

Weekend Analysis: Small Caps New Highs Since April 2022
Weekend Analysis: Small Caps New Highs Since April 2022
Bullish Market Rotation and Market Breadth Improves
Recap
✅ I shared and stuck to my forecast that Small Caps are the leading index and not only would regain 200 but continue higher—last Friday it hit almost 2 year highs.
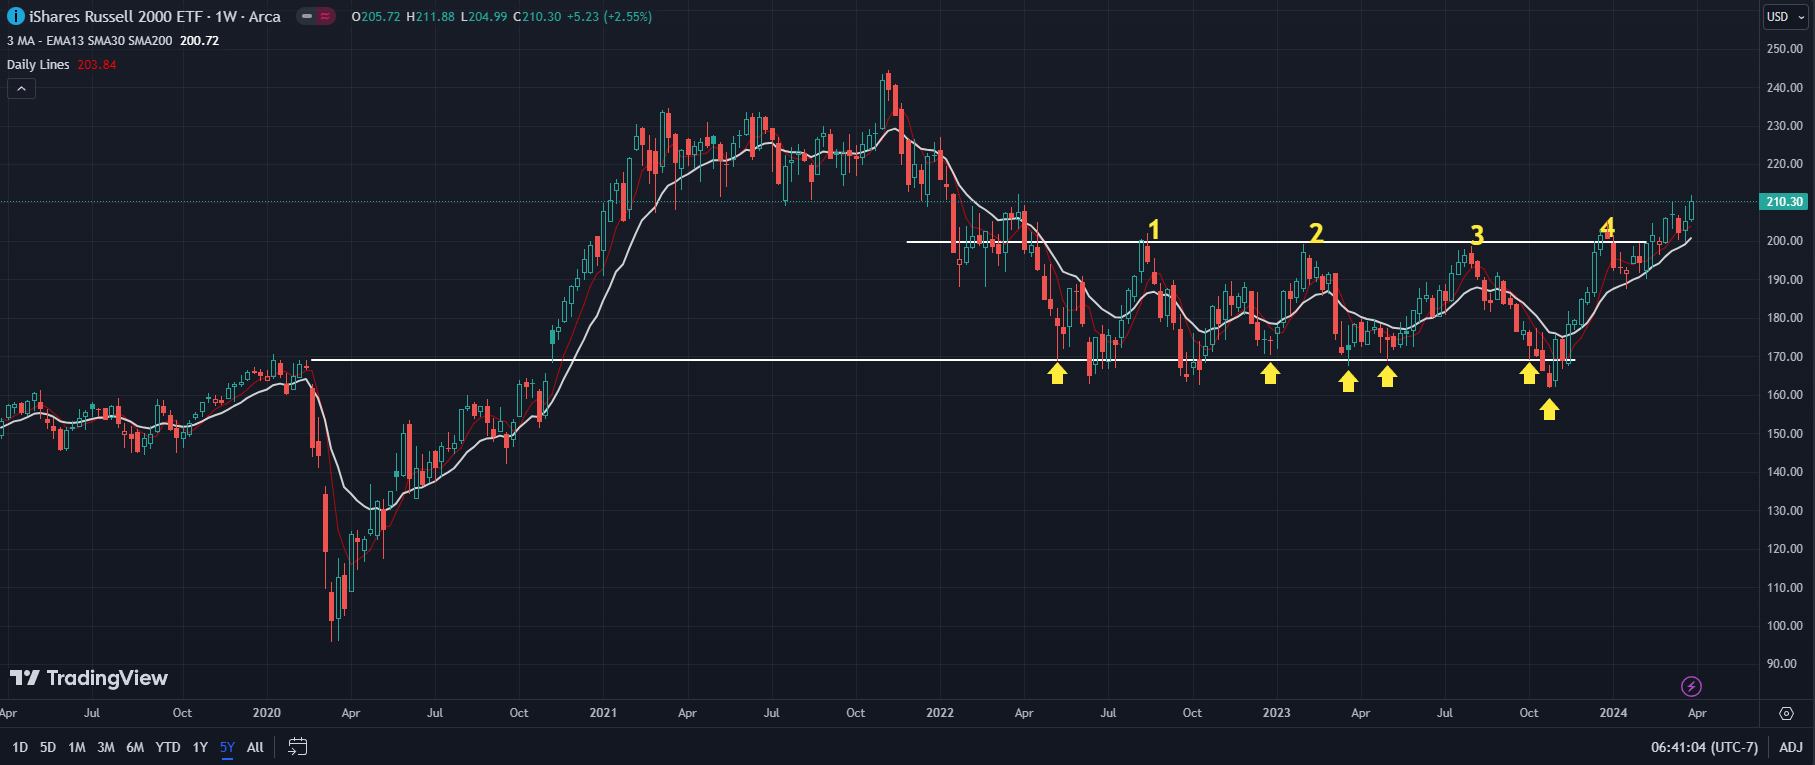
For small caps, minus an economic shock, their worst-case scenario would be if the Fed kept rates higher for even longer than the market expects. Around 40% of the debt small caps have is short-term floating rate debt, compared with about 9% for S&P companies. Per Financial Times, about 30% of Russell 2000 small caps 4th quarter earnings are unprofitable and their earnings fell 17.6% YoY, according to LSEG data. And earnings for SPY rose by about 4% (which was driven majorly by the Magnificent Seven tech stocks).

✅ Not a lot of experts or people forecasted the Golden Path (strong, healthy economic growth with inflation subsiding towards 2.0%)

New 52-Week Highs vs New 52-Week Lows
NYSE New 52-Week Highs: 372 vs New 52-Week Lows: 12
Nasdaq New 52-Week Highs: 280 vs New 52-Week Lows: 49
As I pointed out the interesting new 52-Weeks highs before, they all continue higher (ex: Disney)
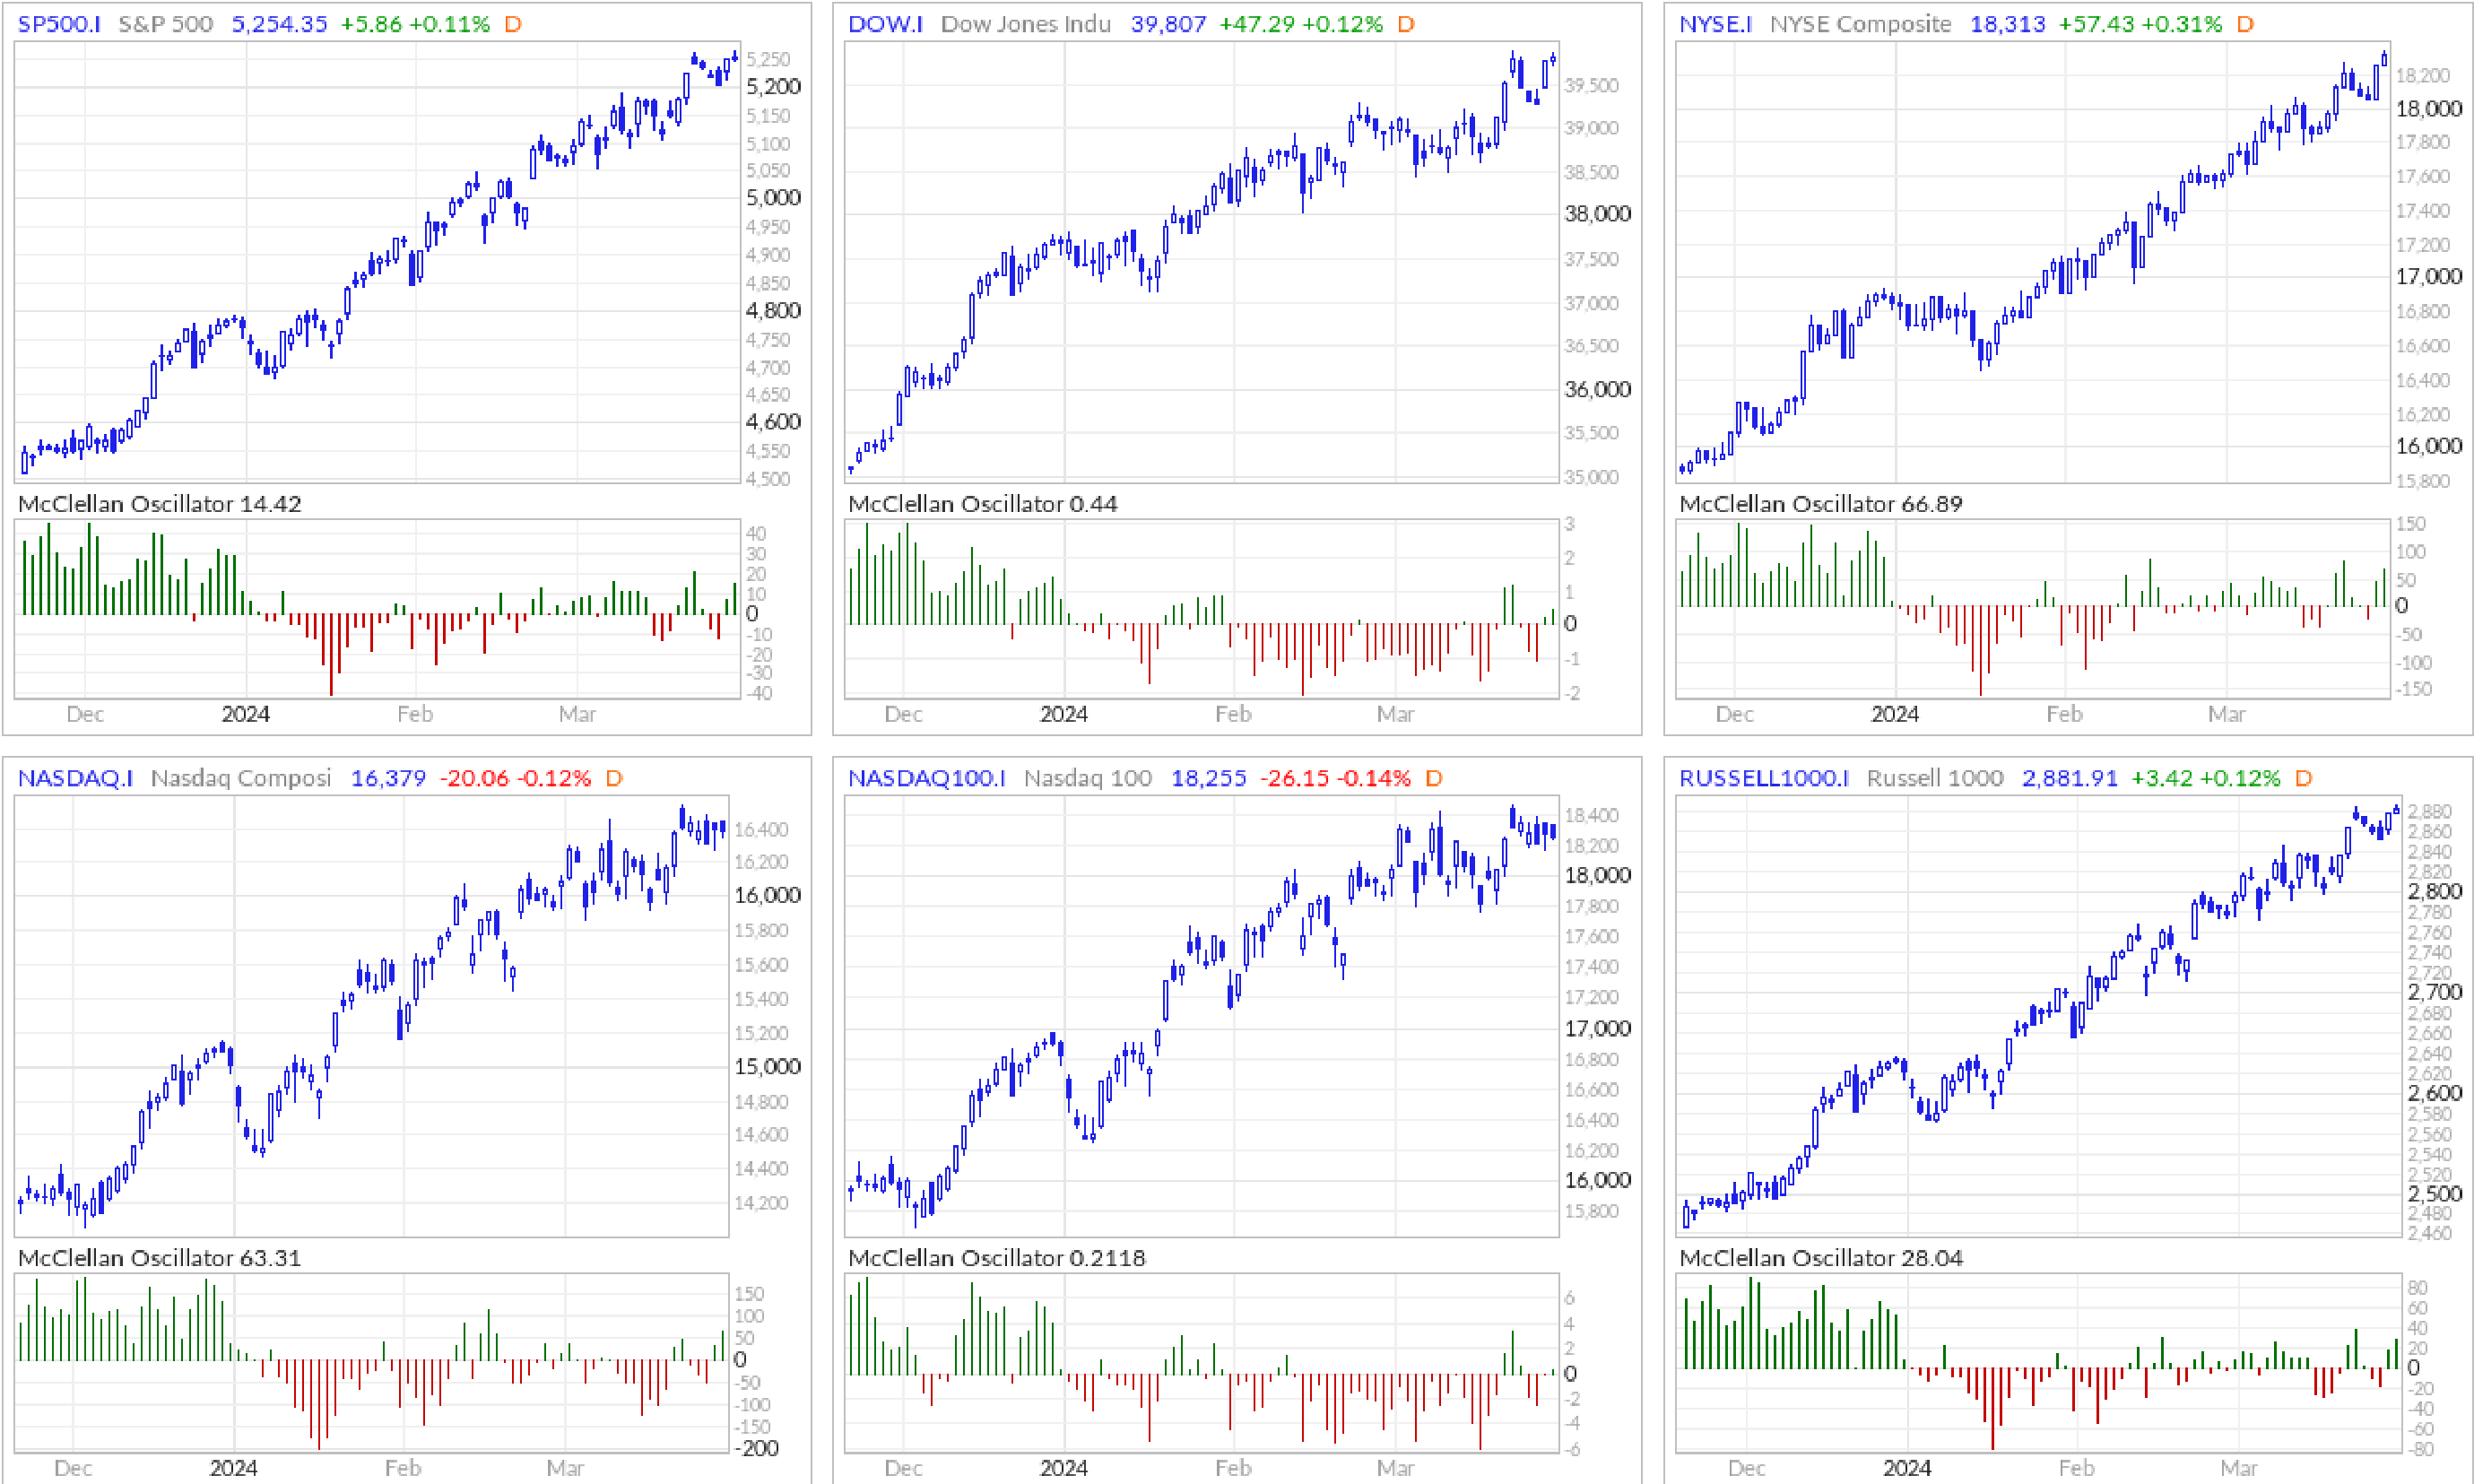
McClellan Oscillator: notice continuing strength
New Highs - New Lows: I forecasted this would recover above the MA10 line and rise higher ✅
*This my personal blog and is not investment advice—I am not a financial advisor but a random person on the internet who does not have a license in finance or securities. This is my personal Substack which consists of opinions and/or general information. I may or may not have positions in any of the stocks mentioned. Don’t listen to anyone online without evaluating and understanding the risks involved and understand that you are responsible for making your own investment decisions.
Past Week
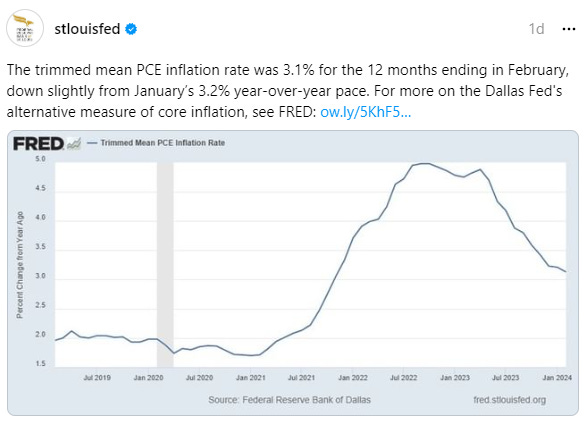
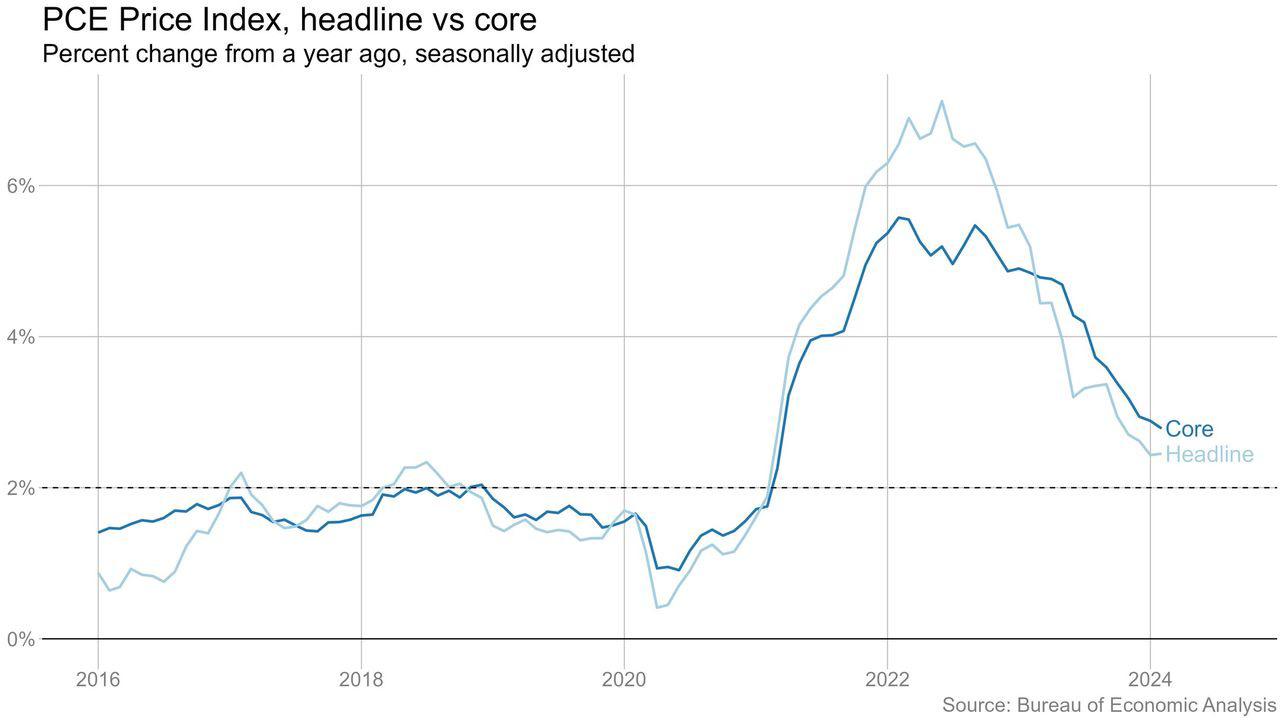
Story is still disinflation but we’re not decisively down to 2.0% yet
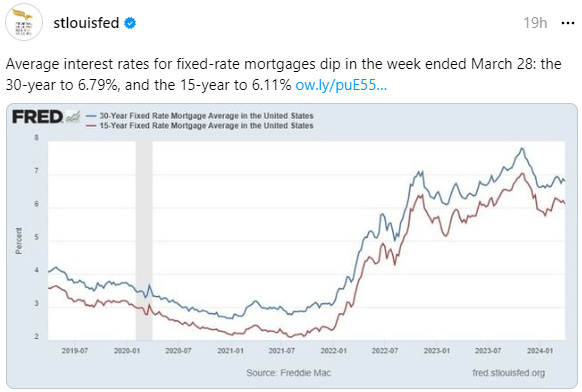
Interest rates for fixed-rate mortgages will come down over time
The wealthier are getting wealthier—this wealth effect is bullish for economic growth and job creation.

Productivity growth is a solid sign of healthy economic growth. This data is positive with the bottom wage earners seeing their financial situations improve better relative to higher wage earners—yet another sign of a healthy economy for all.

This is bullish for economic activity

The US economy and resilient GDP growth has surprised almost everyone

Some Concerns
The Supercore inflation number needs to come down in the next month; otherwise the Fed can start to shift away from its more dovish speak and swing back more hawish.

This is an interesting chart that I’m not sure how to read in a the Golden Path that we are now in—but it’s always good to be cautious.

Something to watch closely to see if it will become a trend

Forecast
As I have been pounding the table for many months now, SPX will reach 5400 and we will see Small Caps rise higher as the market rotates and breadth improves.
Below is upcoming US economic reports with my comments:
Keep reading with a 7-day free trial
Subscribe to Best of Twitter/Threads, Analysis & Forecasts to keep reading this post and get 7 days of free access to the full post archives.