


The Upcoming Market Correction
GDPNow Forecast Sharply Drops to -1.5%
Recap
✅ I've been warning that 2025 carries a high risk of a market correction, and while we’re not there yet, the warning signs are becoming increasingly difficult to ignore. The data continues to stack up, reinforcing my concerns, as key economic indicators—like slowing GDP growth, rising inflation risks, and weakening consumer sentiment and demand—suggest that the market’s resilience may soon be tested.
My forecasts don’t happen right away, as in the same week as I am normally early when I make such forecasts—and as the data shifts, especially the GEX flows, I will adapt with it.
New 52-Week Highs vs New 52-Week Lows
NYSE New 52-Week Highs: 61 vs New 52-Week Lows: 143
Nasdaq New 52-Week Highs: 71 vs New 52-Week Lows: 411 ← this is quite a bearish reading!
New Highs - New Lows is trending bearish and making new lows away from the MA10 red line

% Above 200MA—nothing overly bearish yet but notice Nasdaq and Russell charts seem to be trending slowly lower.
% Above 100MA looks a little more bearish

*This my personal blog and is not investment advice—I am not a financial advisor but a random person on the internet who does not have a license in finance or securities. This is my personal Substack which consists of opinions and/or general information. I may or may not have positions in any of the stocks mentioned. Don’t listen to anyone online without evaluating and understanding the risks involved and understand that you are responsible for making your own investment decisions.
Posts of Interest
A sharp drop in GDPNow to -1.5% growth is a warning sign that the economy is contracting and that potential recession narrative can come right back—especially if the upcoming NFP jobs report comes in pretty negative (as in hundreds of thousands of jobs off expectations—which is what I predict in my last article). A negative reading means the economy is shrinking rather than expanding. Historically, a move toward 0% GDP growth is an early warning, and a sharp contraction like this could indicate broader economic distress.

For markets, this is a bearish signal as stocks are priced for growth, and declining GDP means corporate earnings will likely take a hit. Investors typically react by shifting to safe-haven assets like bonds and gold, increasing market volatility.

Additionally, this puts the Federal Reserve in a difficult position—if they remain hawkish, they could deepen the recession, but if they cut rates too soon, inflation could reaccelerate. And the problem is that inflation seems to be reaccelerating and tariffs will only exacerbate inflationary pressures.
Either way, uncertainty will rise and markets do not like uncertainty.
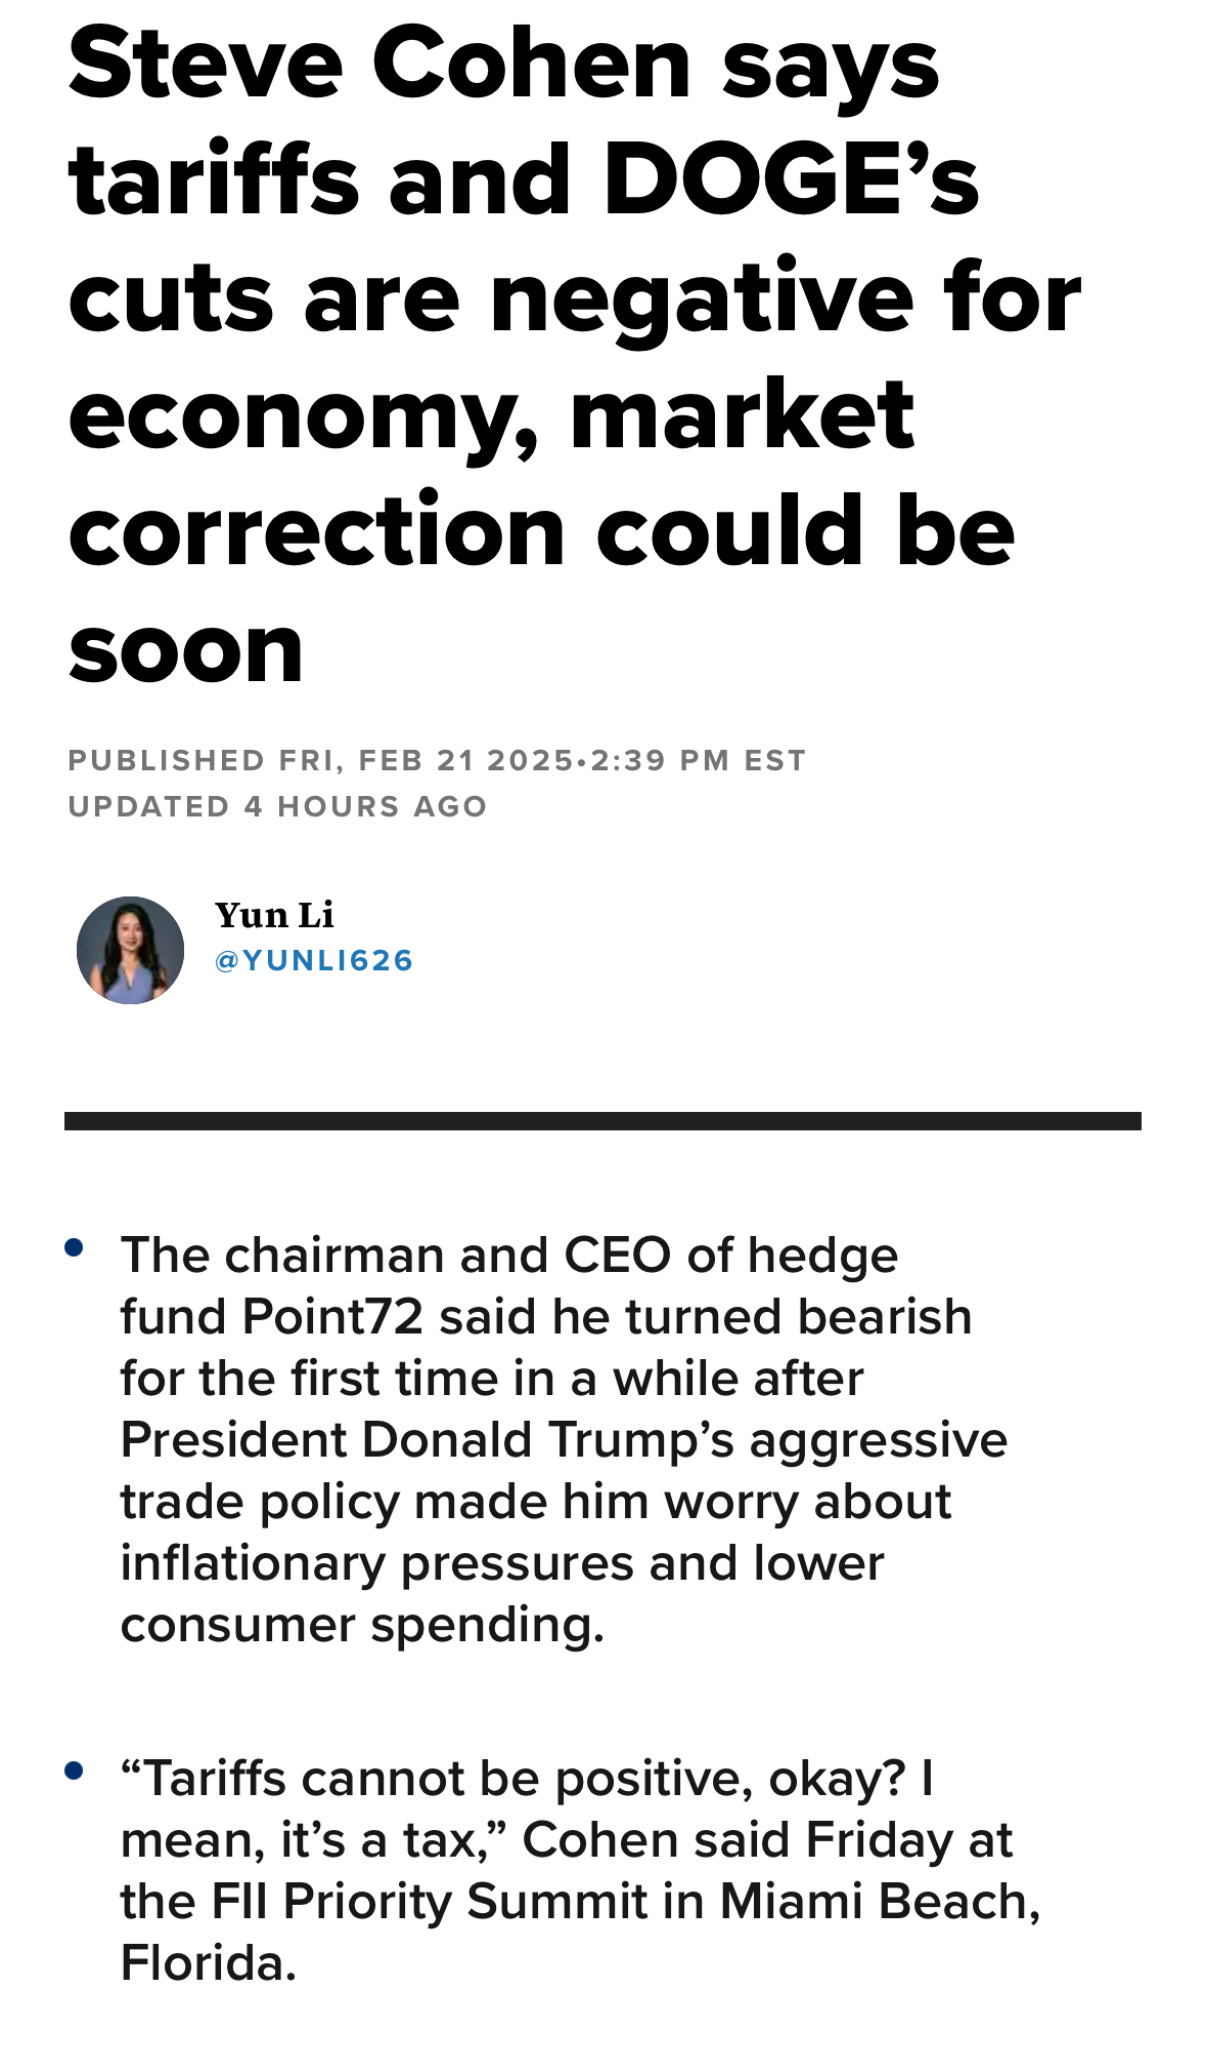
Steve Cohen’s thoughts:
January’s increase in inflation was the largest month over the past year where SUPERCORE was +0.75%—the highest since last Jan—and Truflation data is telling us inflation is going to get worst:
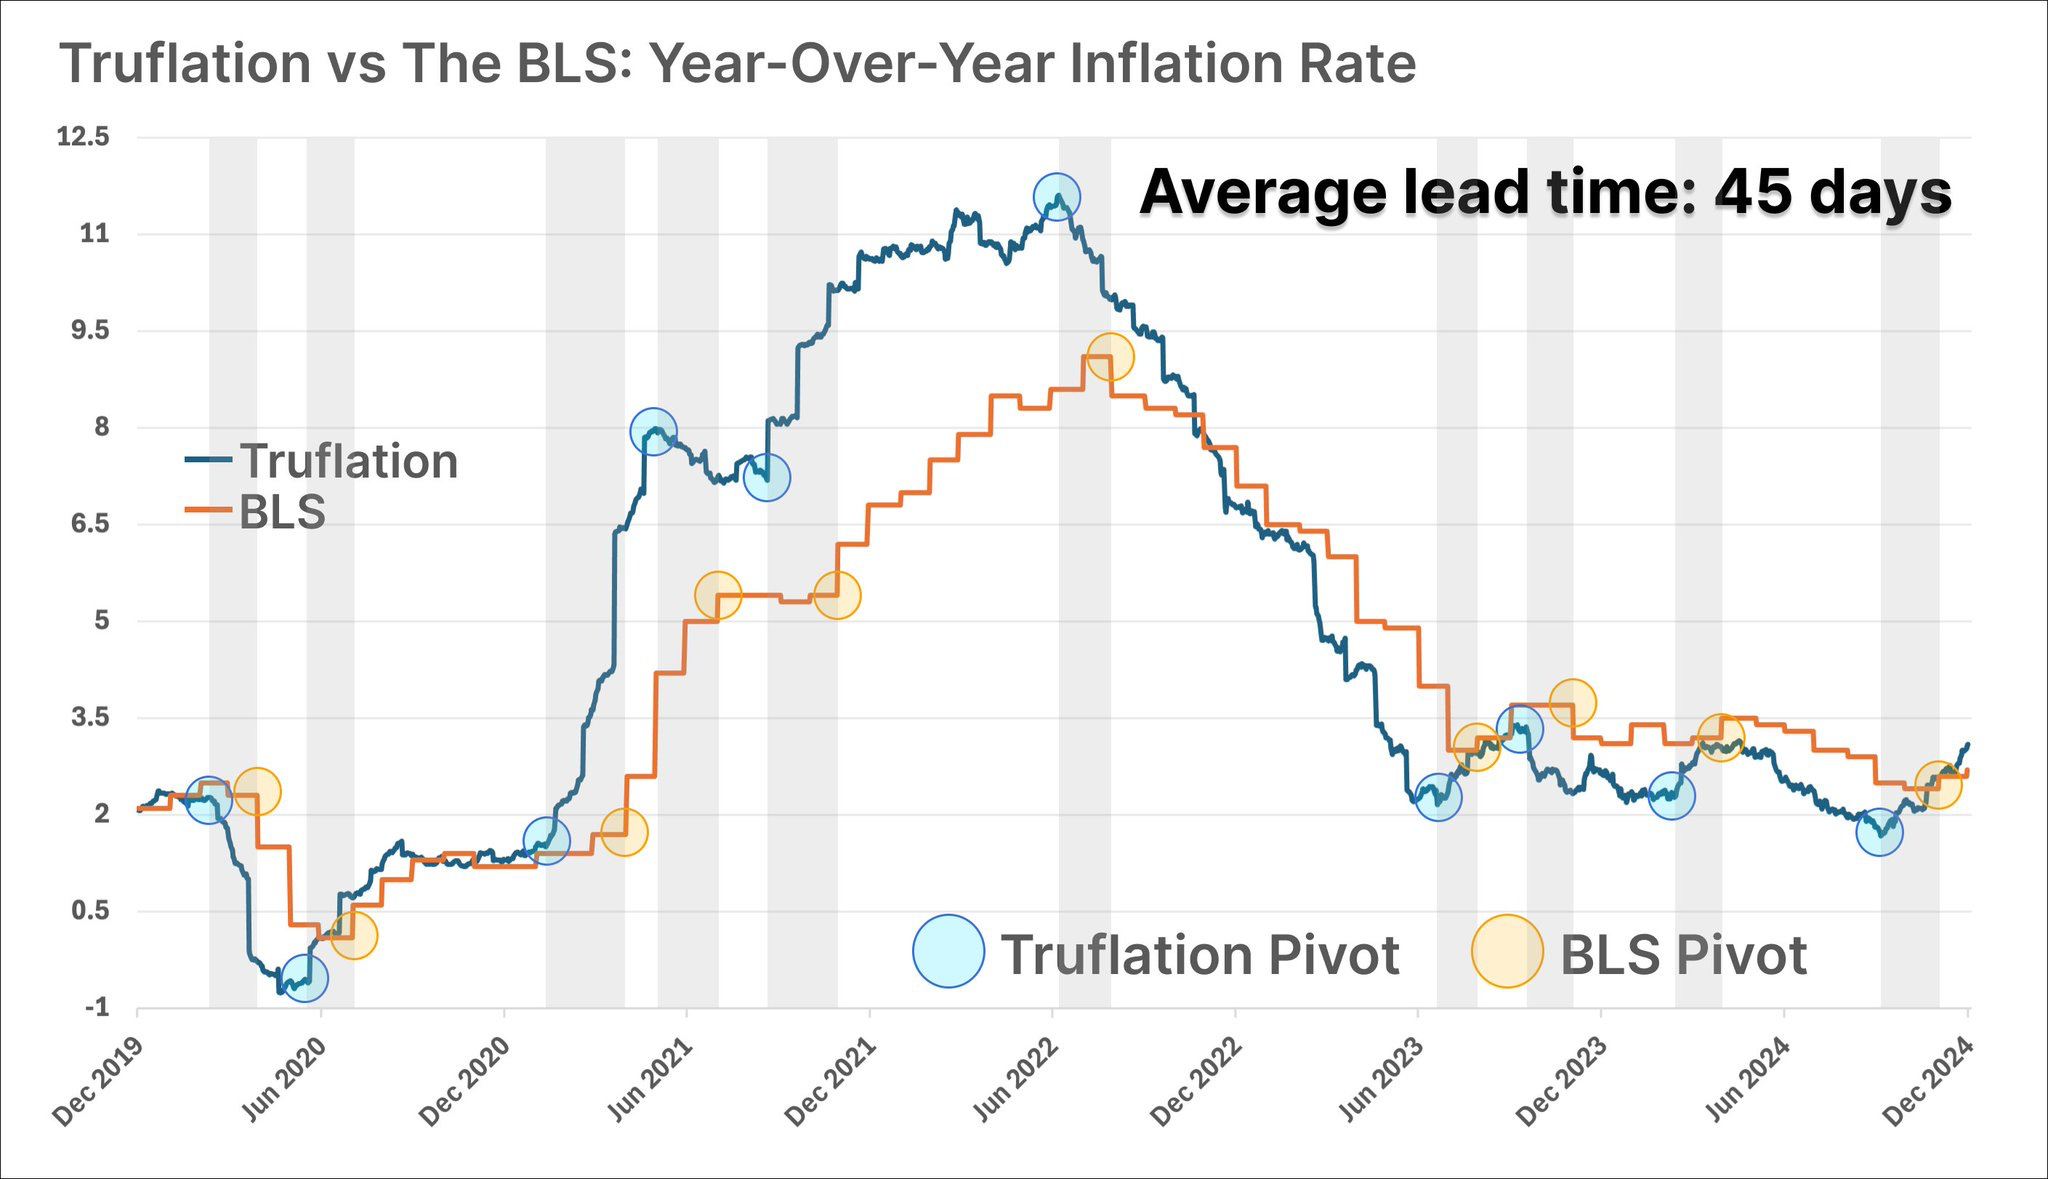
And Truflation forecasts have been quite close to forecasts of the BLS

PPI inflation unexpectedly rose as well:

The market temporarily shrugged off the higher than expected CPI and PPI prints when jobless claims came in fine.
However, recent jobless claims last week came in slightly higher than expected at 242,000 vs 225,000 and New Home sales as well as Pending Home Sales came in below expectations. If this trend continues it is a concerning sign for the US economy.

Forecast
When the 125-Day Moving Average is tested, we usually see some bounce.

Stock Price Breadth continues lower and is unable to make a new high from Dec 2024.

VIX is now well above it’s 50-day moving average

Keep reading with a 7-day free trial
Subscribe to Best of Twitter/Threads, Analysis & Forecasts to keep reading this post and get 7 days of free access to the full post archives.