Recap
My forecast for 2025—that was quite a sizable bounce.

✅ SPX bounced right above SPX 5750 level at 5773.31
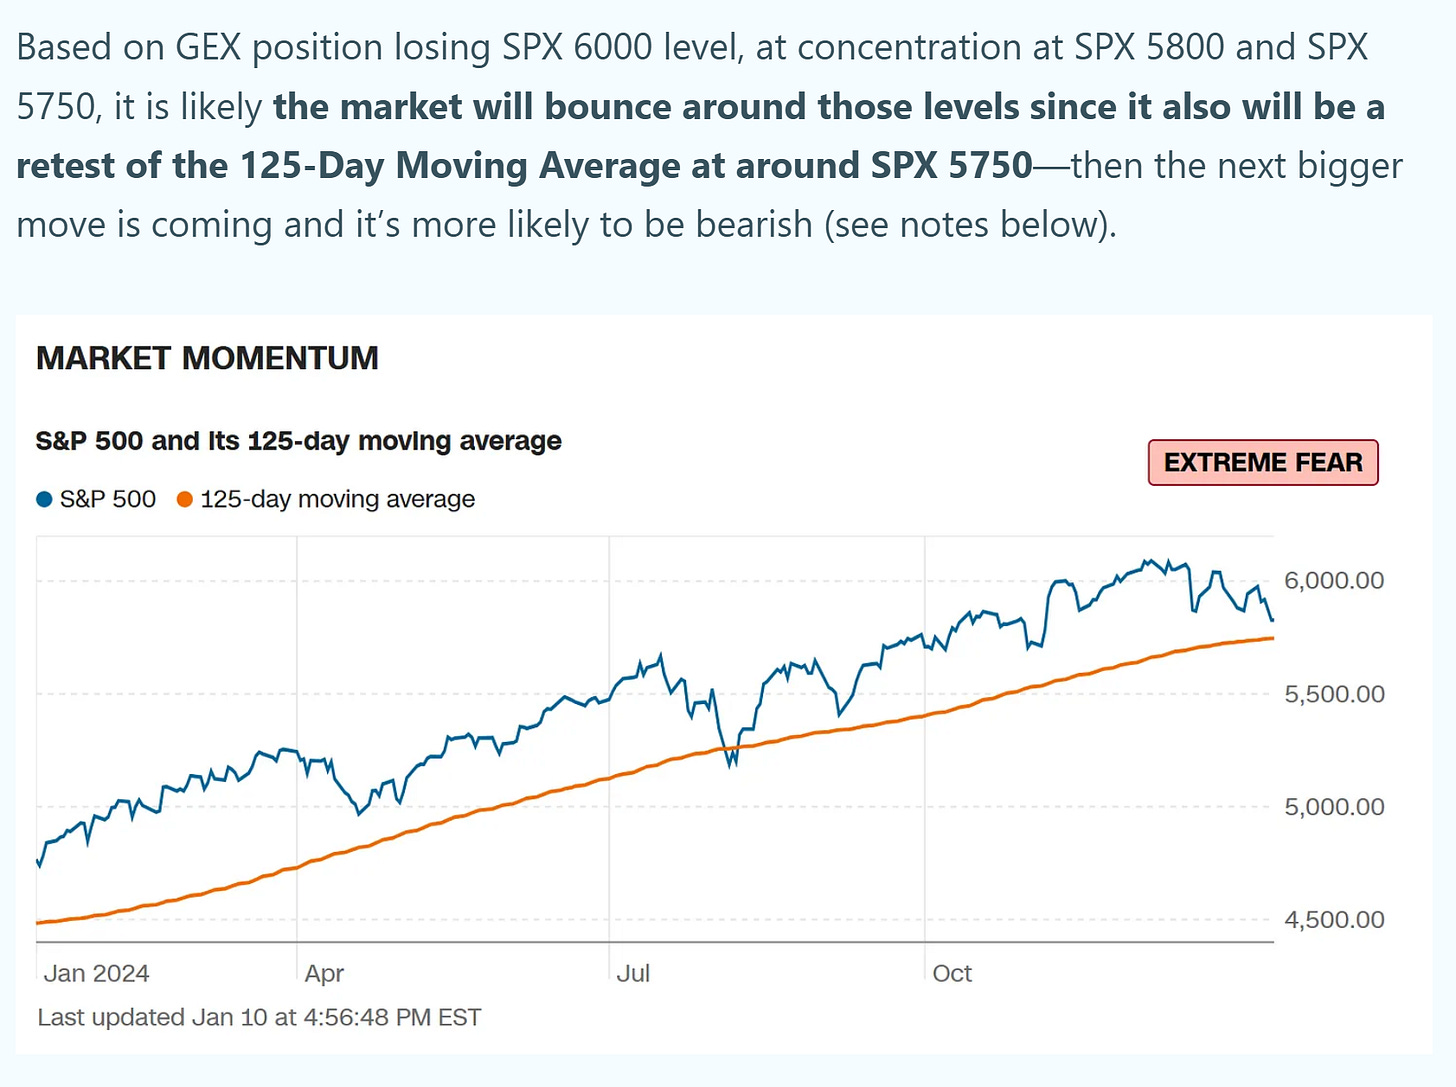
When SPX falls close to its 125 Day Moving average, dip buyers tend to get rewarded.
❌ The December 2024 Consumer Price Index (CPI) report offered a welcome reprieve, as Core CPI (excluding food and energy) rose by a milder-than-expected 0.2% month-over-month (MoM) after four consecutive months of 0.3% MoM increases. And headline CPI rose 0.4% MoM in December, in line with expectations.
New 52-Week Highs vs New 52-Week Lows
NYSE New 52-Week Highs: 112 vs New 52-Week Lows: 12
Nasdaq New 52-Week Highs: 183 vs New 52-Week Lows: 68
McClellan Oscillator fully rebounds from the sell off due to the better than expected CPI reading
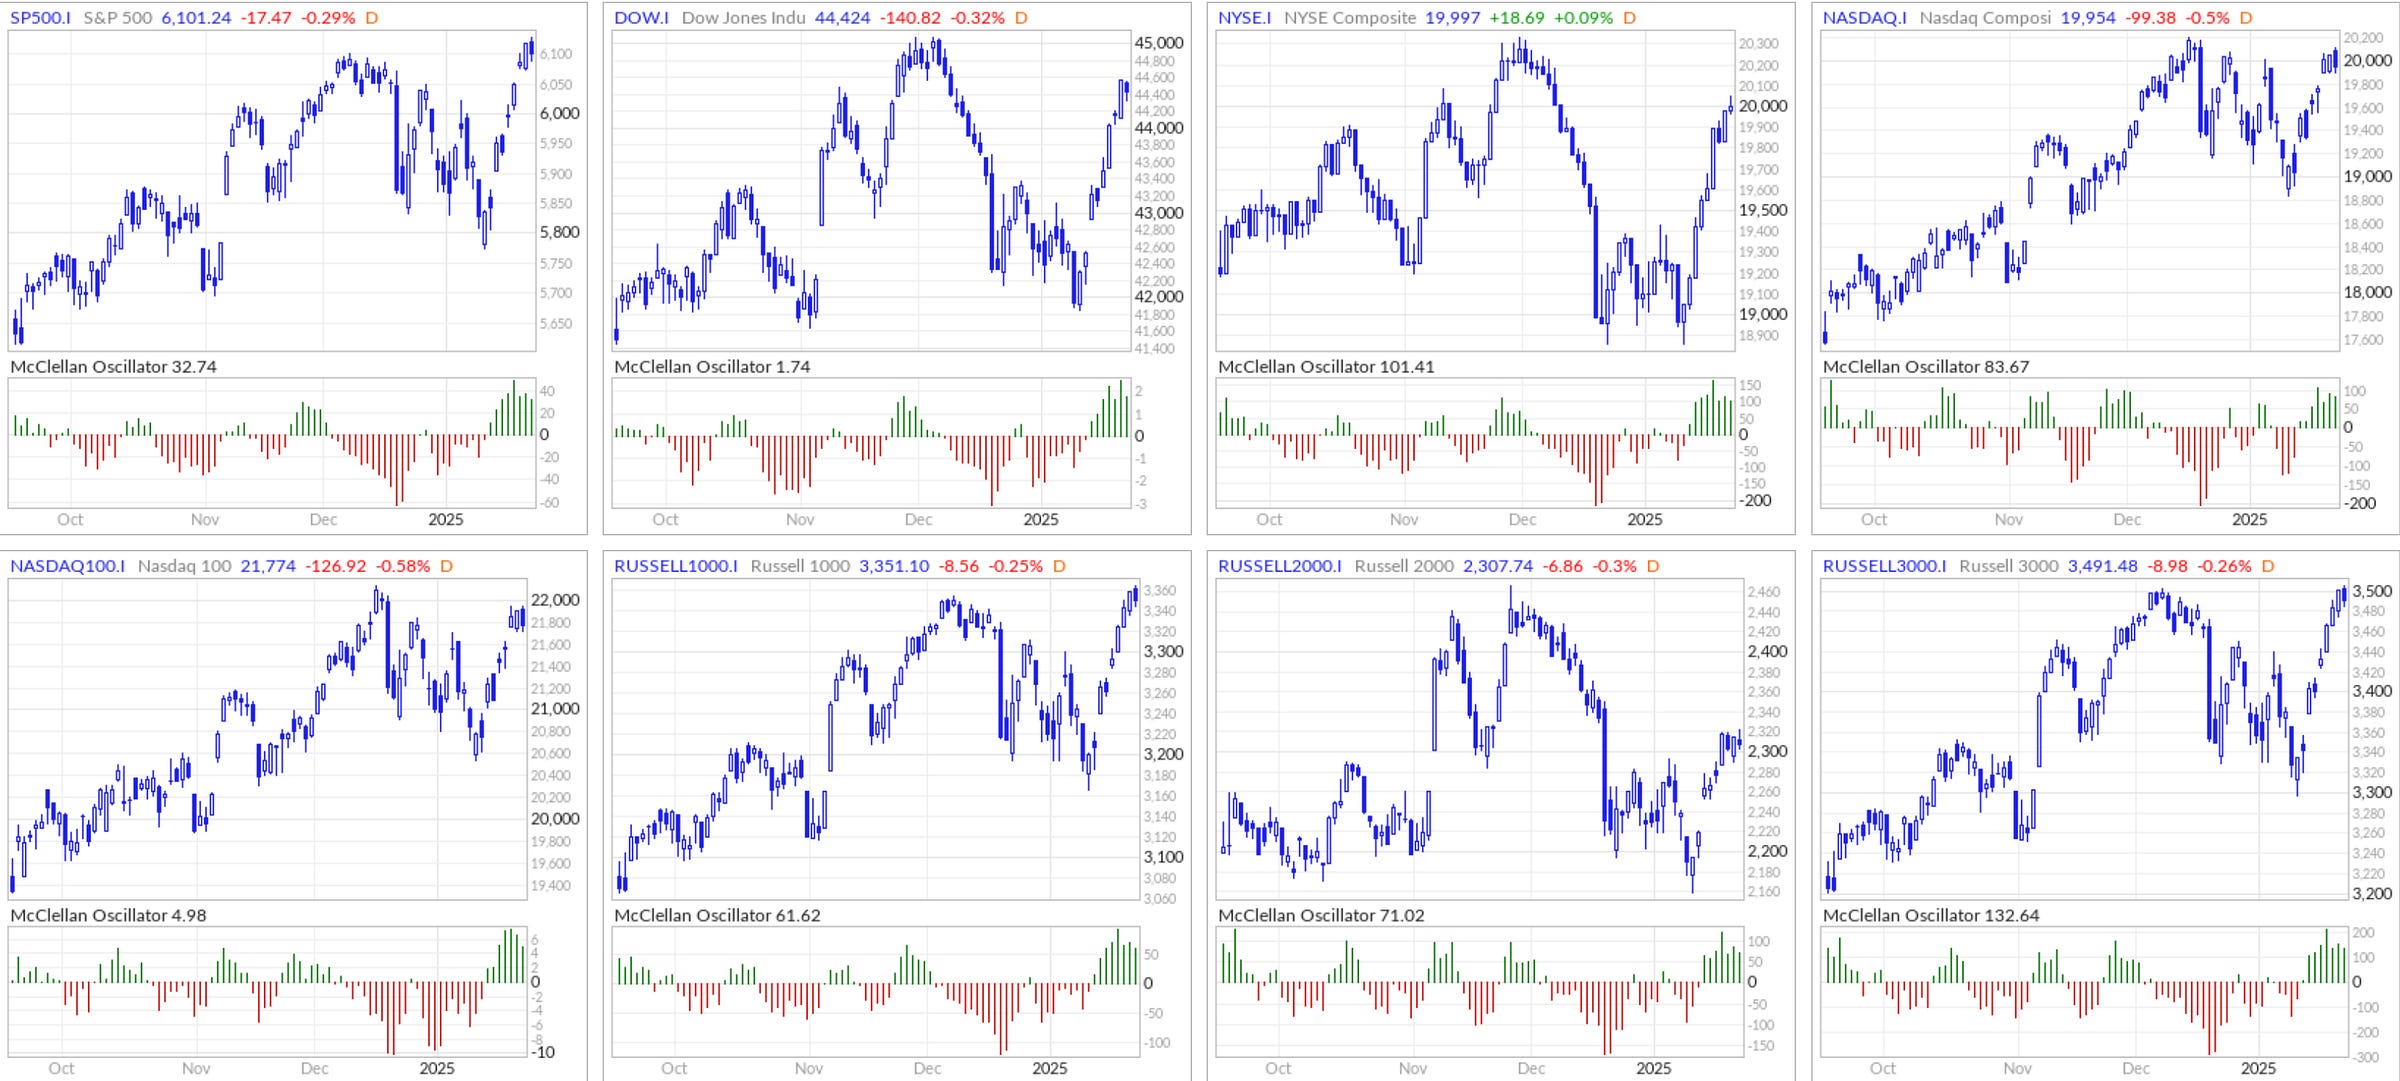
The McClellan Summation Index (MSI) rebounds from the sell off (this is a longer-term indicator)
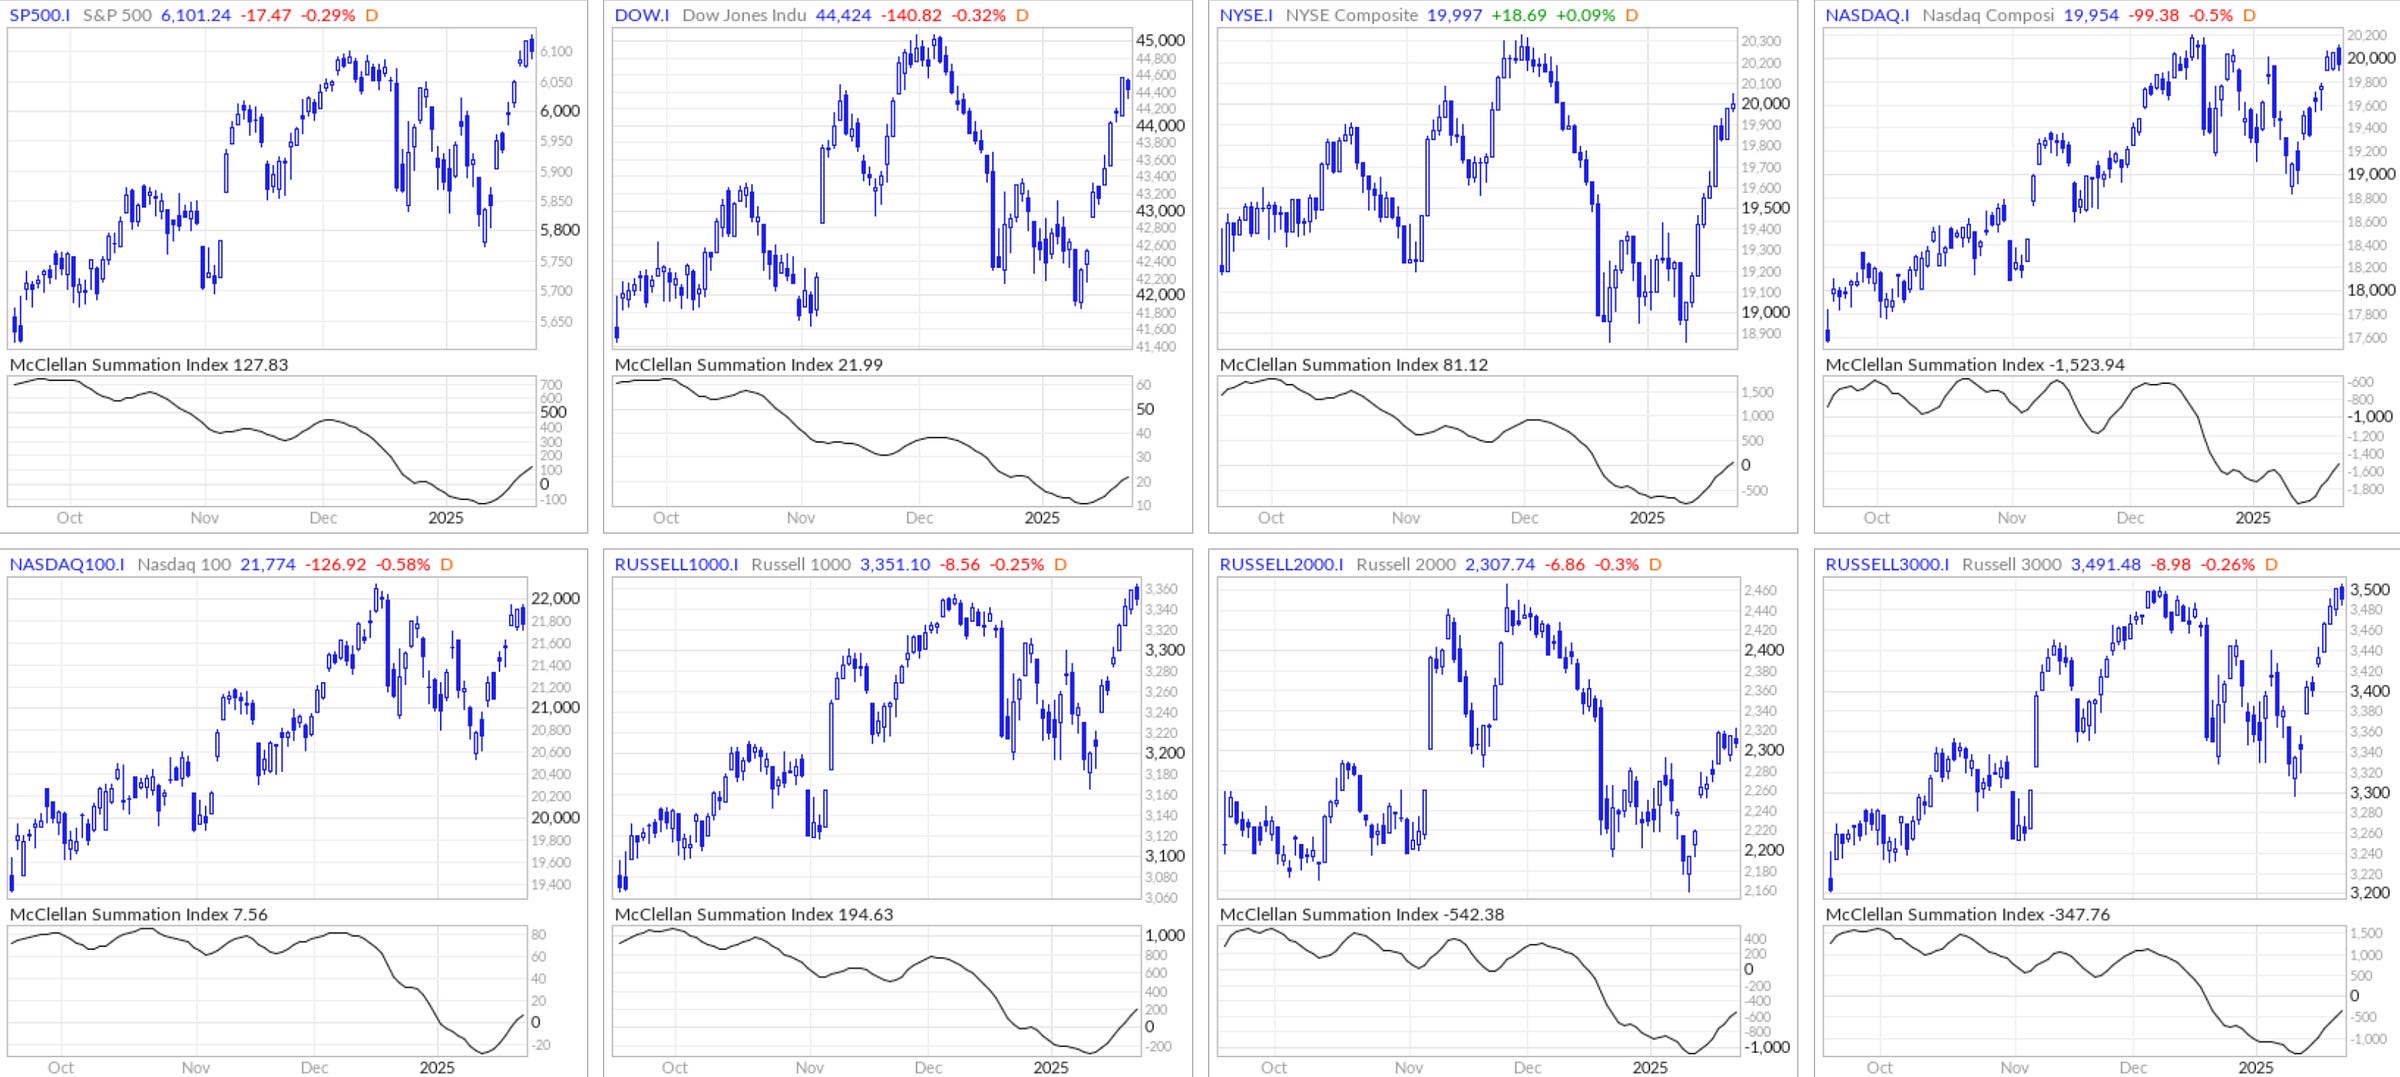
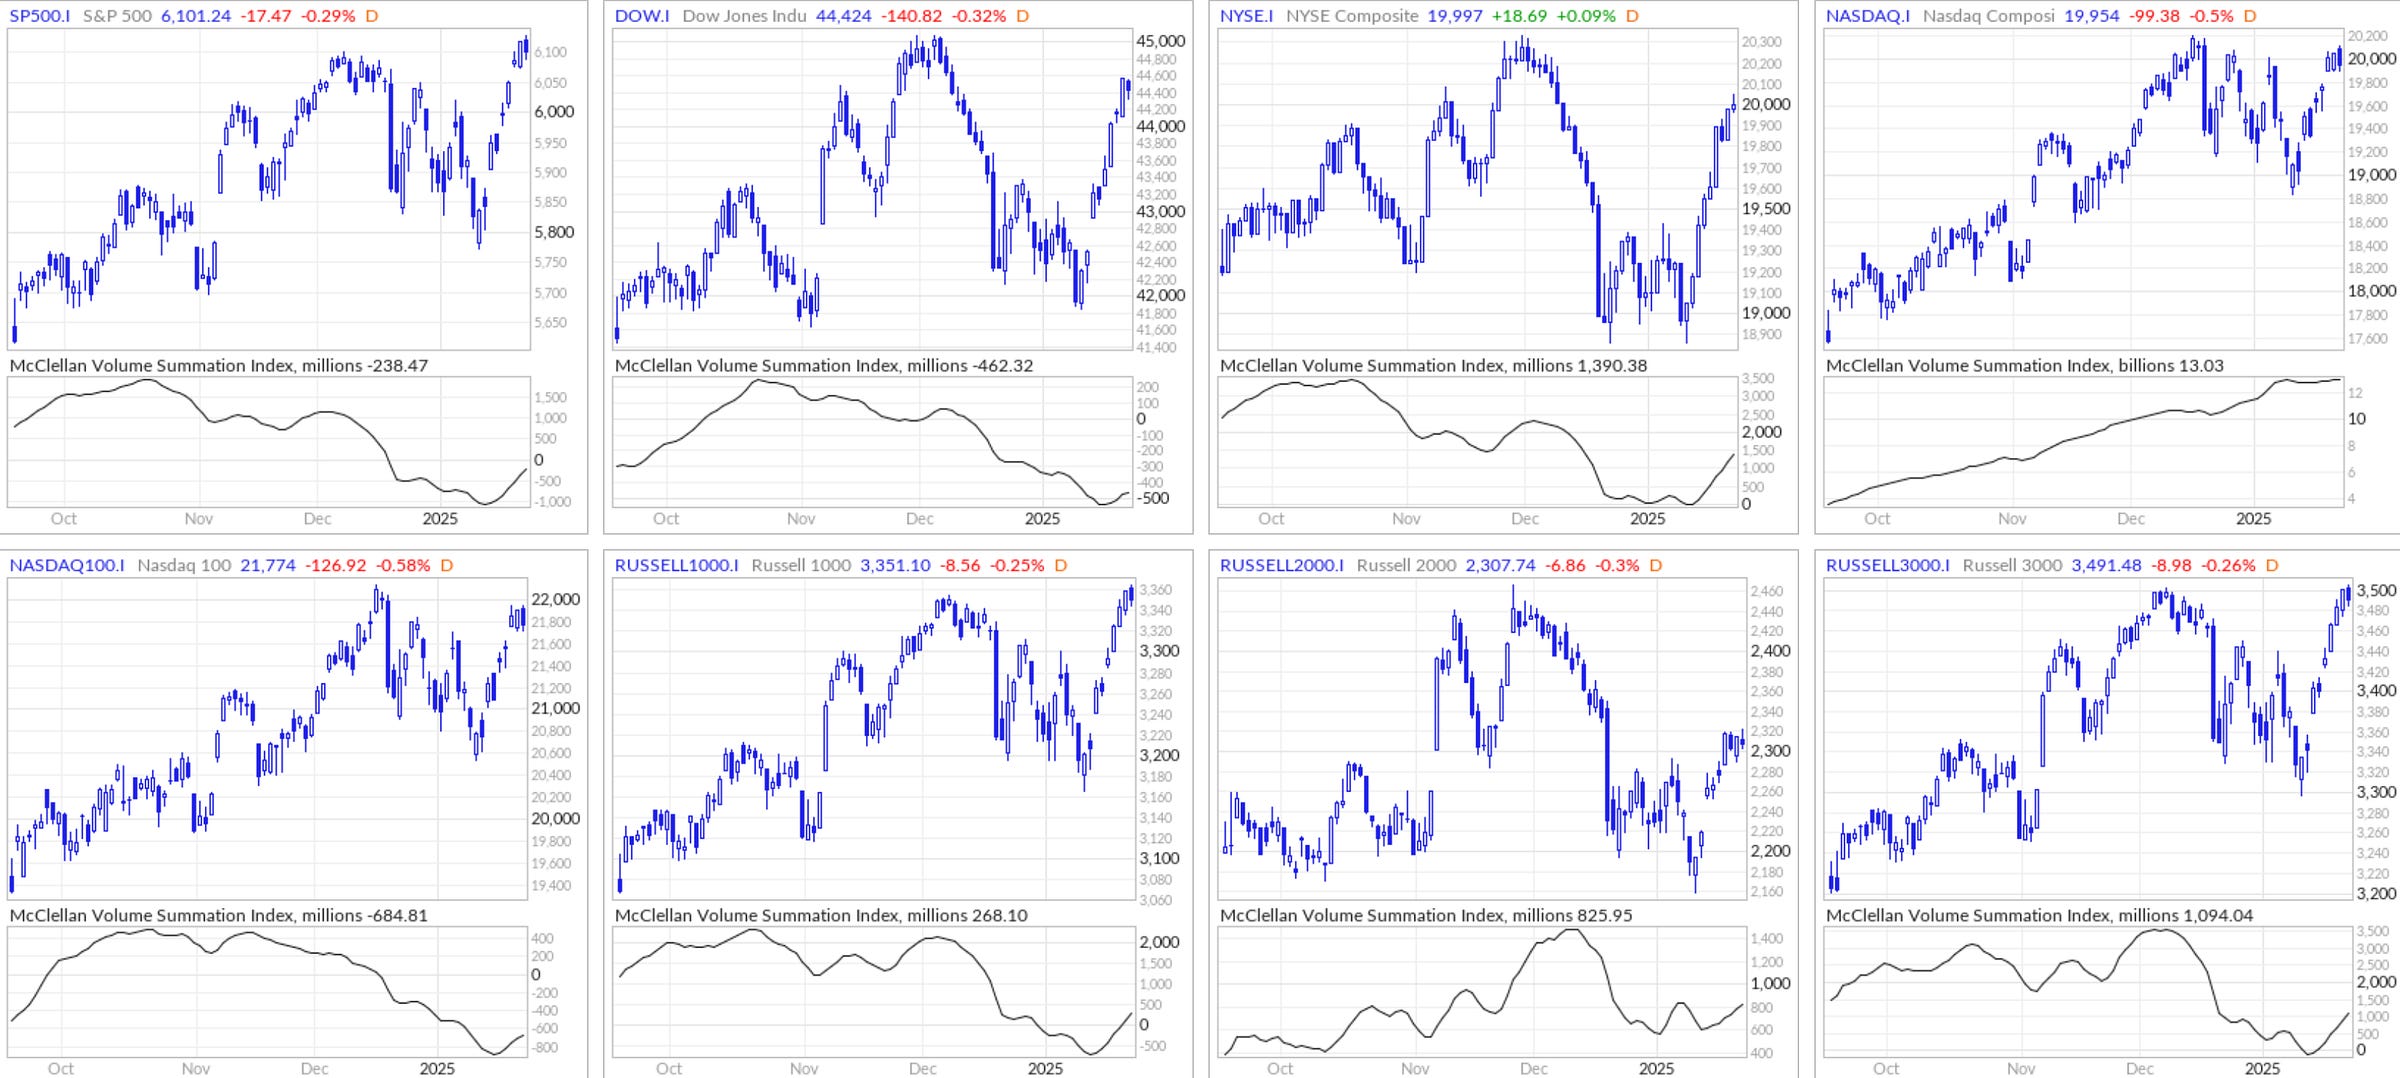
McClellan Volume Summation Index rebounds (this is a longer-term indicator)
*This my personal blog and is not investment advice—I am not a financial advisor but a random person on the internet who does not have a license in finance or securities. This is my personal Substack which consists of opinions and/or general information. I may or may not have positions in any of the stocks mentioned. Don’t listen to anyone online without evaluating and understanding the risks involved and understand that you are responsible for making your own investment decisions.
Trump Inflation and the Fed’s Challenge of 2.0% Inflation Target
Maintaining or lowering inflation at the rate we’ve seen in 2024 to 2025 would require either negligible price increases or outright deflation in some categories—a challenging feat given economic trends (bank earnings and jobs growth have been very healthy).
While headline inflation moderated in 2024, maintaining that momentum in 2025 will be challenging due to:
A higher starting base for YoY comparisons.
Persistent price pressures in services and labor-intensive sectors.
Volatility in energy and commodity markets—how much lower can oil prices go with such strong economic activity?
We could see stubbornly high inflation against the Fed’s policy response as Trump potentially exacerbates the issue by following through on his threats to impose new tariffs. Although Columbia is a small country, when tariffs are raised against Canada to Mexico (much larger trading partners), it will not help with 2025 inflation levels.
Although Columbia mitigated the situation (thankfully because Columbia supplies 40% of the US coffee), will this same happen with all our other trading partners?
Again, the 2018 US-China trade war caused a large market correction and based on what Trump is doing, I don’t see how we don’t build up towards another trade war with much larger trading partners like China, Mexico, Canada, etc.
Trump’s Inauguration: The Upcoming DXY Wrecking Ball
At Trump’s inauguration, his emphasis on tariffs raises the specter of escalating trade tensions, a scenario that could ripple through the global economy. Tariffs, often aimed at protecting domestic industries, can lead to retaliatory measures, disrupt global supply chains, and stifle international trade. Coupled with a strengthening U.S. dollar, this scenario poses a dual risk: tariffs create headwinds for global commerce, while a rising DXY exacerbates financial stress across emerging and developed markets.
A soaring U.S. dollar—often referred to as a DXY wrecking ball—magnifies global economic vulnerabilities. For countries with significant dollar-denominated debt, a stronger dollar increases repayment costs, leading to tighter financial conditions and potential defaults. Emerging markets are especially susceptible, as they often rely on external borrowing and dollar-based trade. Additionally, a stronger dollar reduces the competitiveness of U.S. exports by making them more expensive, while simultaneously increasing the cost of imports for other countries, fueling inflation and eroding purchasing power.
Will Trump be able to address inflation pressures and his administration help bring inflation back down to the elusive 2.0% target? He is already trying to influence Powell to lower interest rates and threatening emergency tariffs on US trade partners.
GDP Growth
Projections sit at 3.0% but it will be interesting to see if this kind of GDP growth can sustain throughout 2025.
Bank Earnings
Record bank earnings such as JP Morgan’s recent quarterly earnings report can signal potential risks. Historically, excessive profitability in banking has sometimes preceded financial stress or an economic downturn:
Overextended Credit Cycles: Record earnings can reflect loose lending standards or unsustainable growth in consumer and corporate debt. If delinquencies rise due to higher rates or slowing economic growth, banks may face losses in the future.
Economic Imbalances: Higher profits often align with elevated interest rates. While this benefits banks, it increases the debt servicing burden for consumers (credit card debt has surpassed $1.2 trillion, with the average credit card interest rate now exceeding 20%) and corporations.
Market Sentiment: Strong results from financial institutions can raise concerns about whether the market is overheating, leading to fears of a correction if valuations outpace fundamentals.
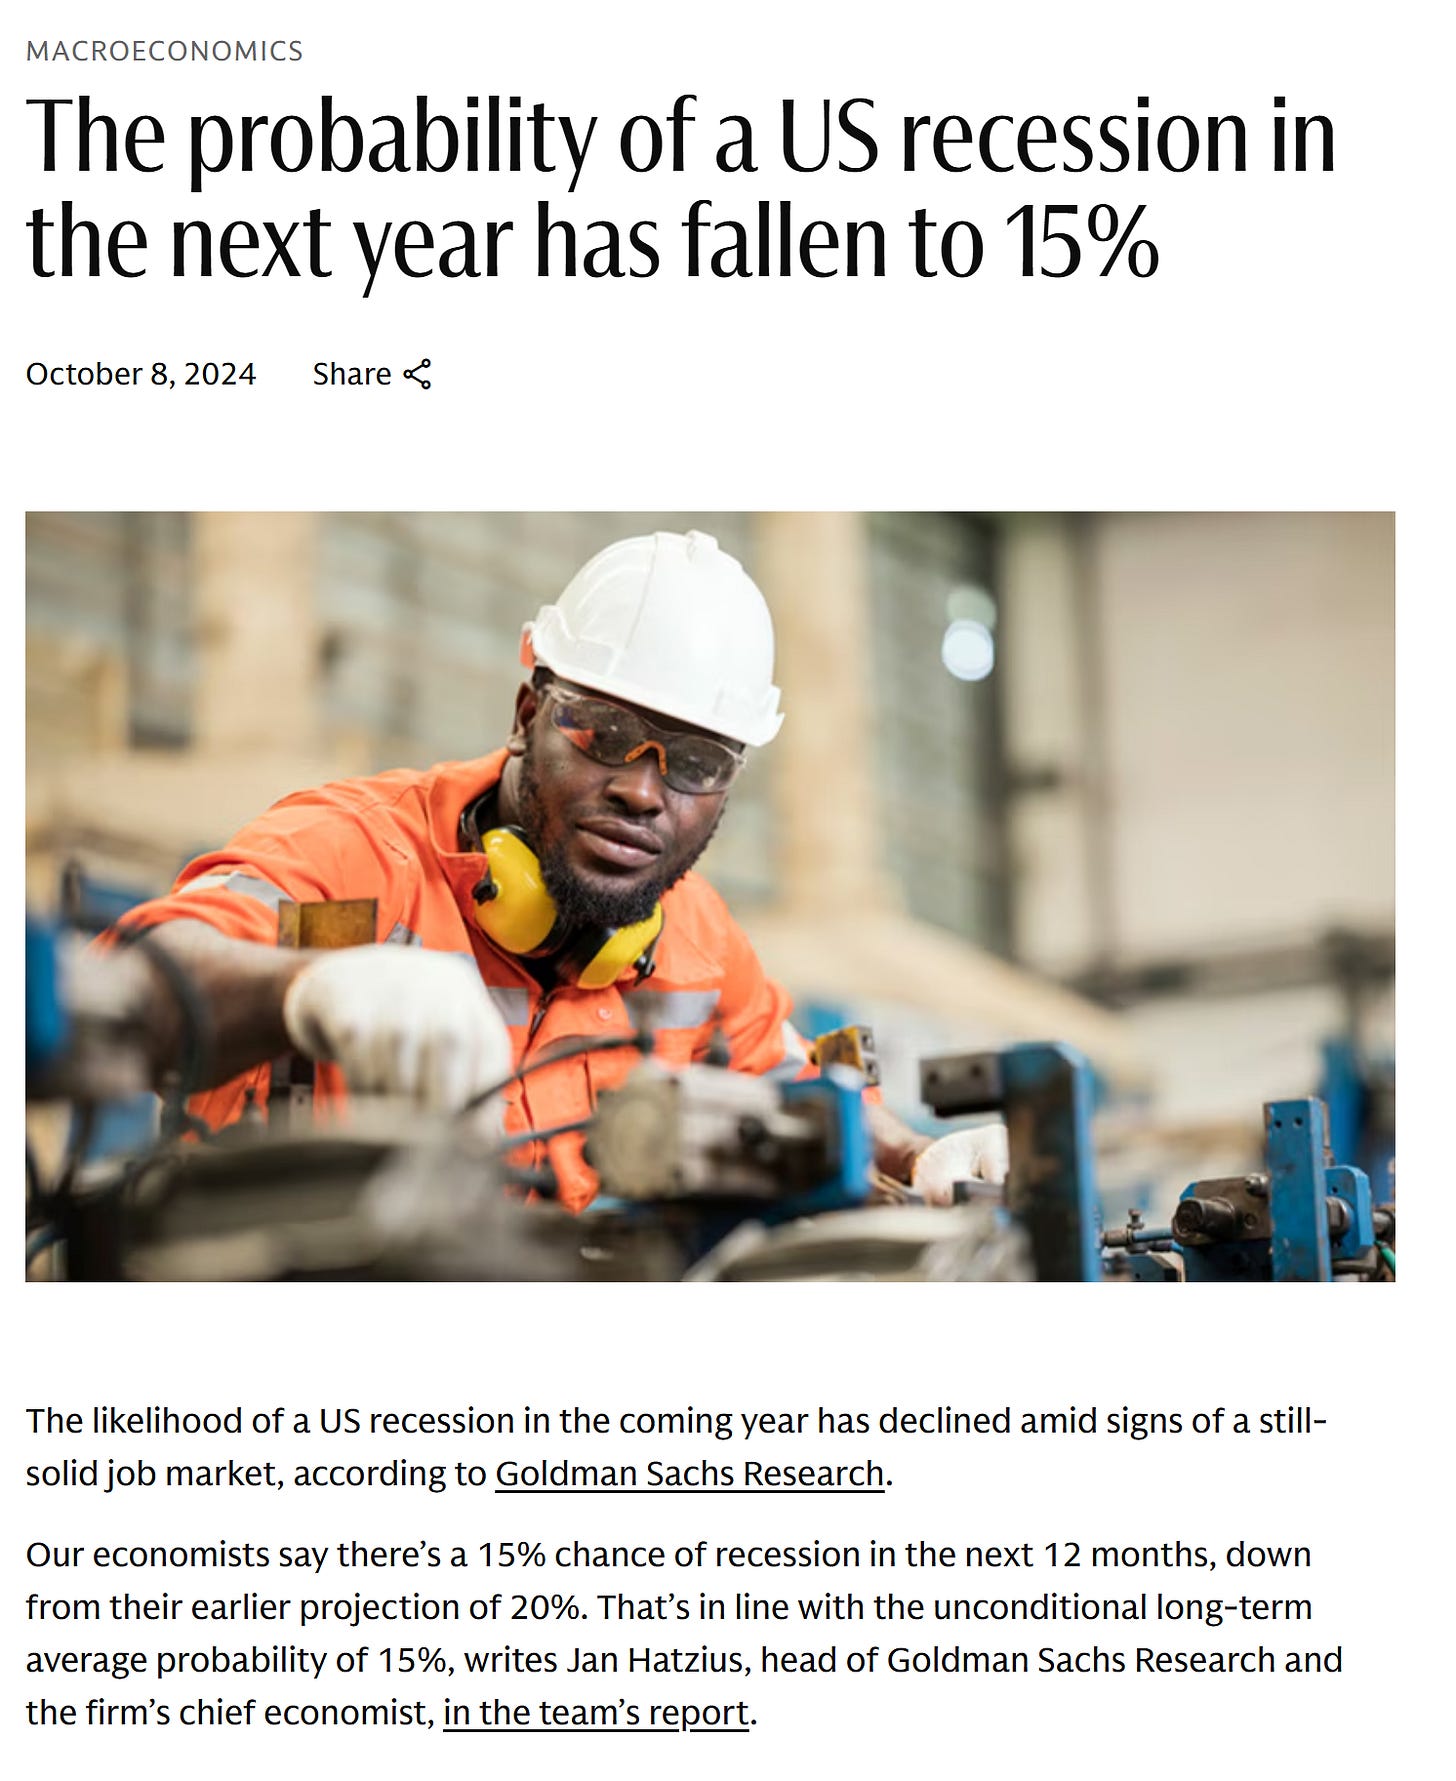
Back during 2022-2023 when the market saw many companies retesting COVID lows and majority of media and banks were projecting recession, I remained bullish throughout emphasizing that we could be on a “Golden Path scenario”—which played out accurately:

The majority of media and banks are now ruling out probability of recession significantly and that means we should be cautious—it doesn’t mean we will see a correction come soon as the bull market can run further.
Forecast
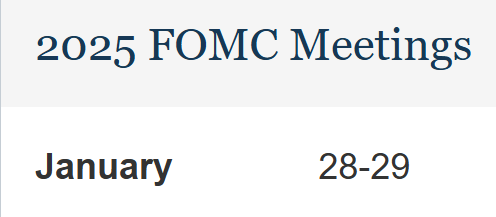
We are likely going to see the market potentially test up to SPX 6200—but that depends on the upcoming FOMC meeting Jan 28-29 (where the Fed could potentially add more uncertainty around inflation getting back to 2.0% target) and jobs report for Jan 2025 reporting in early Feb.
Market bounced when everyone was 40% bearish right back to 40%+ bullish in 1 week and the 40.6% bearish was the highest bearish % during the past year—since bearish sentiment made a new low, this can be seen as more volatile for markets. Usually in healthy bull markets, we don’t see Fear indicators making newer 1 year highs.
Keep reading with a 7-day free trial
Subscribe to Best of Twitter/Threads, Analysis & Forecasts to keep reading this post and get 7 days of free access to the full post archives.


