

The Market Correction Came, What's Next
Wait for full capitulation, buying the dip early can be painful
Recap
✅ Over the past few months, I’ve consistently warned about three converging risks: the return of Trump-era tariffs (where I kept reminding readers his trade war with China back in 2018 cause a market correction!), the difficulty of getting inflation sustainably back to the Fed’s 2.0% target, and the growing likelihood of a market correction in 2025.
I laid out these concerns across a series of posts:
Jan 27 – The Return of Volatility
Feb 2 – Volatility is Back. Tariffs.
Feb 9 – When Macro Starts to Matter, Micro Stops to Matter
Feb 16 – How Will DOGE Cuts Impact February’s Jobs Report?
Each piece flagged the early signs and briefly explained by thesis and concerns —volatility reappearing, softening growth, and inflation stickiness—that were setting the stage for a correction.
Then came the all-time high on Feb 19, with the S&P 500 hitting 6,147.43. Ironically, a few subscribers left, perhaps thinking I was early or just plain wrong. But markets tend to punish complacency. Just days later, equities began to roll over.
On March 2, I published The Upcoming Market Correction—and the very next day, the market finally cracked.
I was not able to post much because I had crazy wedding planning for my wedding on March 29—so I choose to let go of the noise and choose to be fully present. I’ve done the work and laid out the thesis so it was time to just relax and enjoy my wedding and honeymoon.
New 52-Week Highs vs New 52-Week Lows
NYSE New 52-Week Highs: 19 vs New 52-Week Lows: 230
Nasdaq New 52-Week Highs: 30 vs New 52-Week Lows: 204
When you look at 52-Week New Highs vs 52-Week New Lows over the past weeks the data continues to not look promising.
New Highs - New Lows
The indices need to comfortably get back above the 0 level for a few days.

McClellan Volume Summation Index
Is saying we are in a major trend reversal—we’re in a bear market now and this signal cannot be ignored. In bear markets, we tend to see vicious counter-trend rallies to the upside only to fall lower.

Percentage of Stocks Above the 200-day Moving Average
This is a long term indicator and we are making new lows—also not a good sign for 2025.

*This my personal blog and is not investment advice—I am not a financial advisor but a random person on the internet who does not have a license in finance or securities. This is my personal Substack which consists of opinions and/or general information. I may or may not have positions in any of the stocks mentioned. Don’t listen to anyone online without evaluating and understanding the risks involved and understand that you are responsible for making your own investment decisions.
Posts of Interest
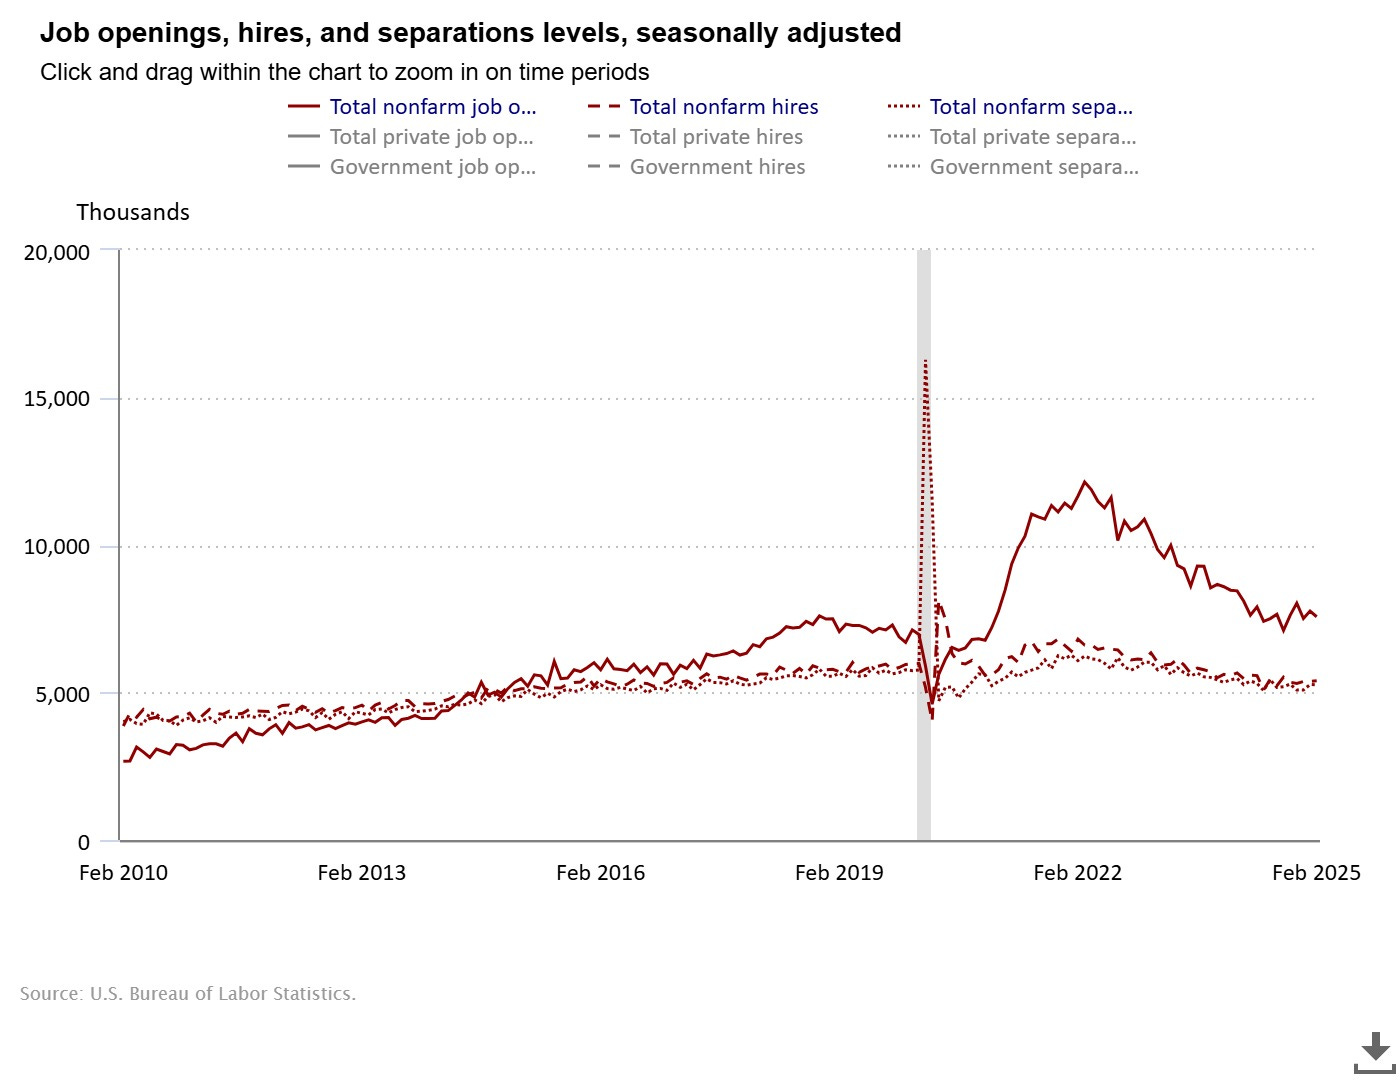
JOLTS job openings should fall precipitously once April month data comes out—and the bear market moves will come roaring back.
Forecast
This tariff war is far from over—and the Trump administration has reintroduced a high degree of uncertainty and policy volatility into the markets. Markets can price in risk, but the market really struggles with chaos, and that’s exactly what this erratic trade policy is creating.
The indicators I follow can signal when market bottoms happen and I’ll try to keep readers informed week to week.
Keep reading with a 7-day free trial
Subscribe to Best of Twitter/Threads, Analysis & Forecasts to keep reading this post and get 7 days of free access to the full post archives.