
Macro Conditions Are No Longer "Undeniably Bullish"
The Lag Effects of Tariffs and De-Globalization
Recap
✅ When SPX was hovering around 6,000, I shared my view that a melt-up was likely on the horizon. Two months later, the index surged past 6,400, setting new all-time highs as the macro data continued to support the bullish momentum. I didn’t publish an update during that stretch—not because there was nothing to say, but because the market was largely unfolding as expected based on my prior Substack posts. I was also traveling through Saudi Arabia and Korea during that time.
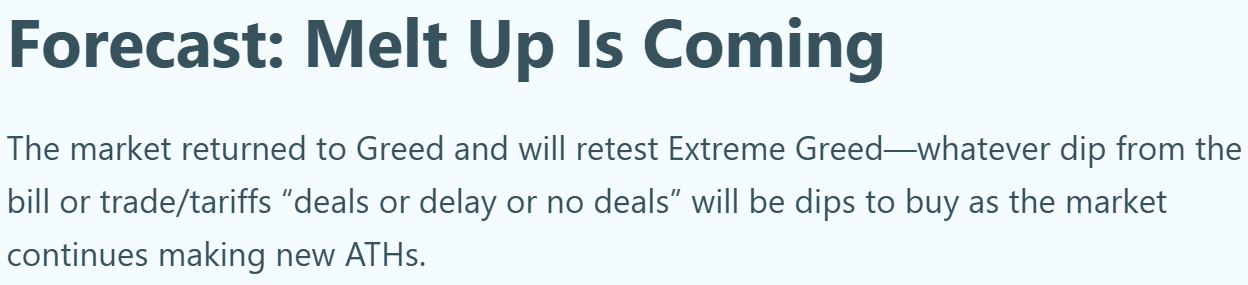
We have fallen back down to Neutral
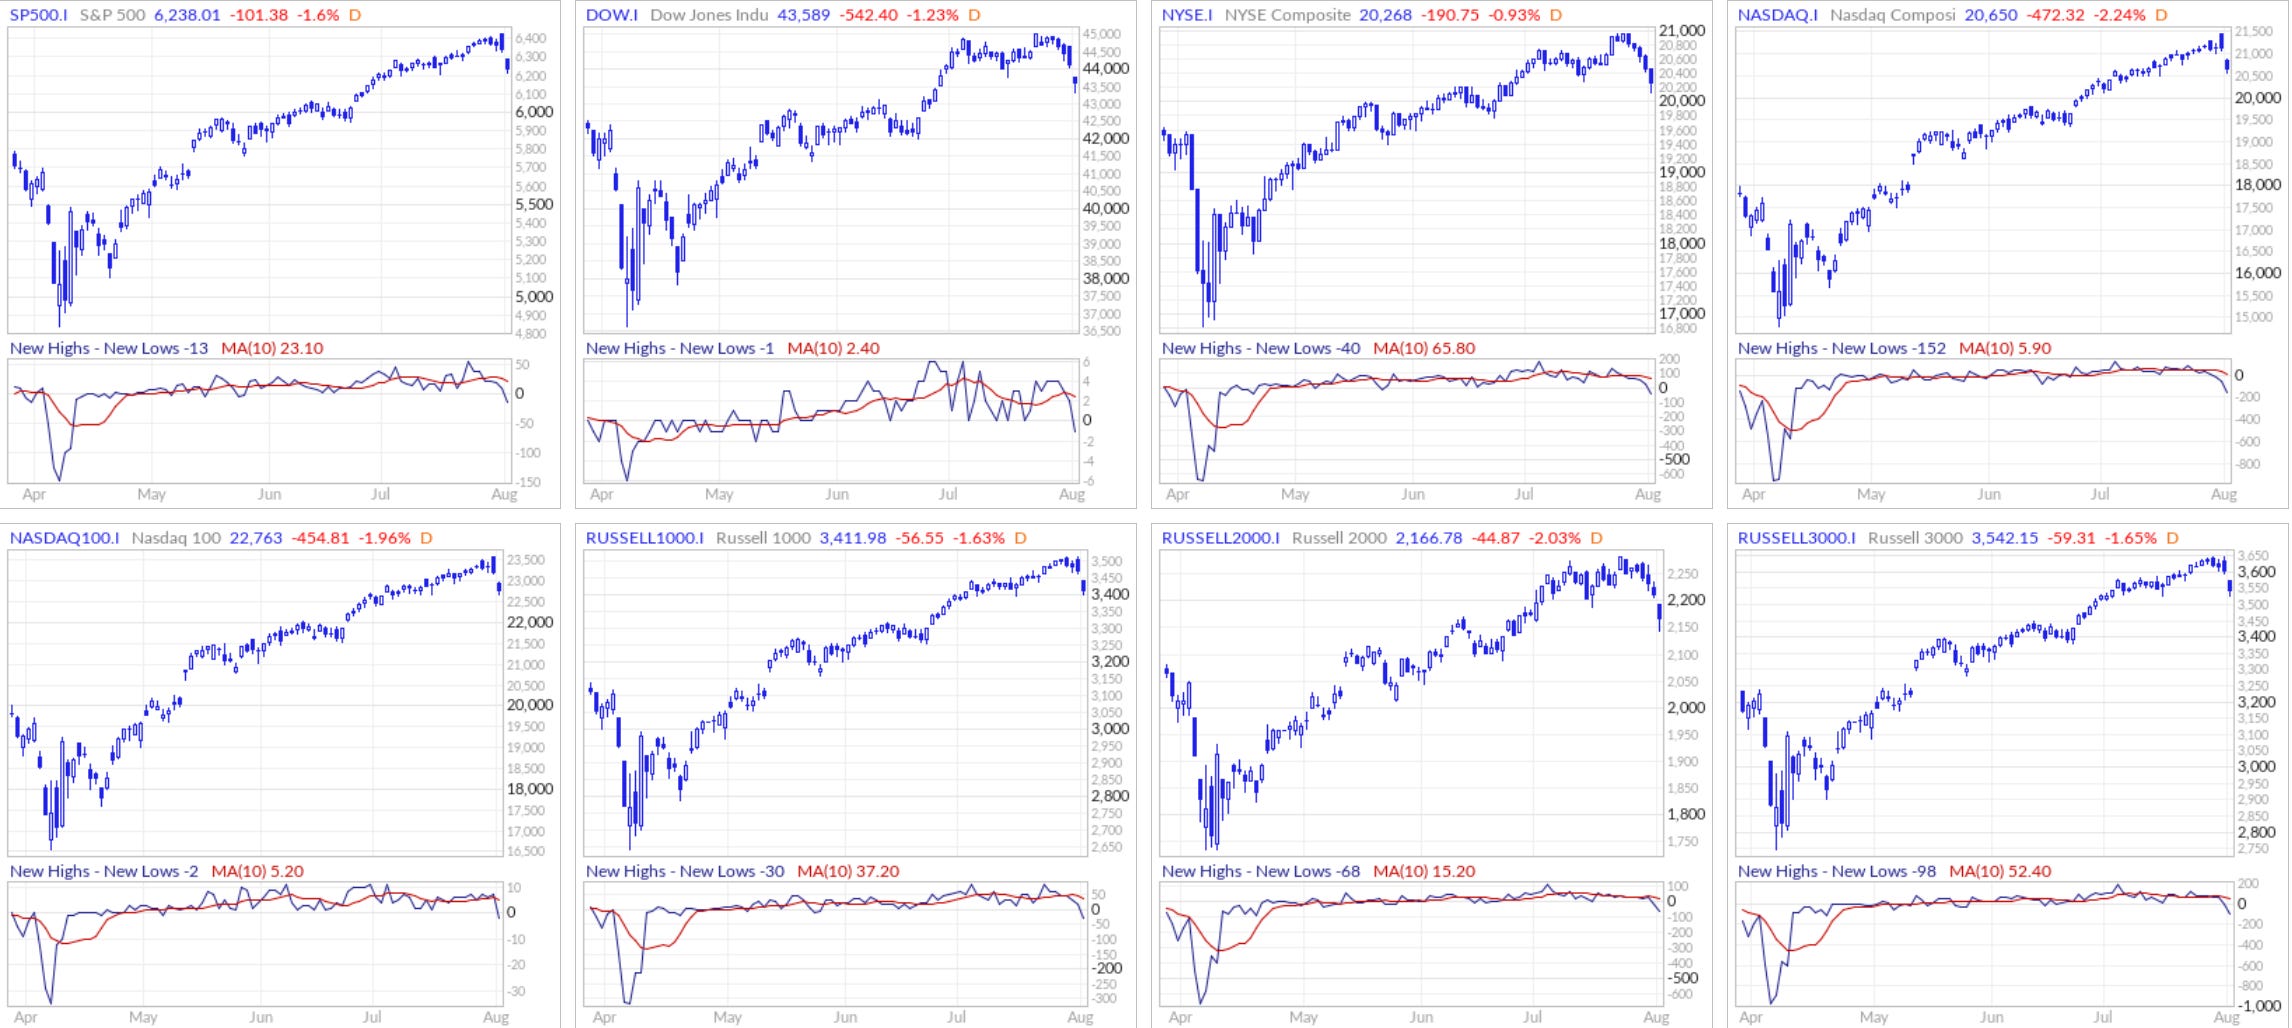
New 52-Week Highs vs New 52-Week Lows
NYSE New 52-Week Highs: 35 vs New 52-Week Lows: 96
Nasdaq New 52-Week Highs: 50 vs New 52-Week Lows: 229
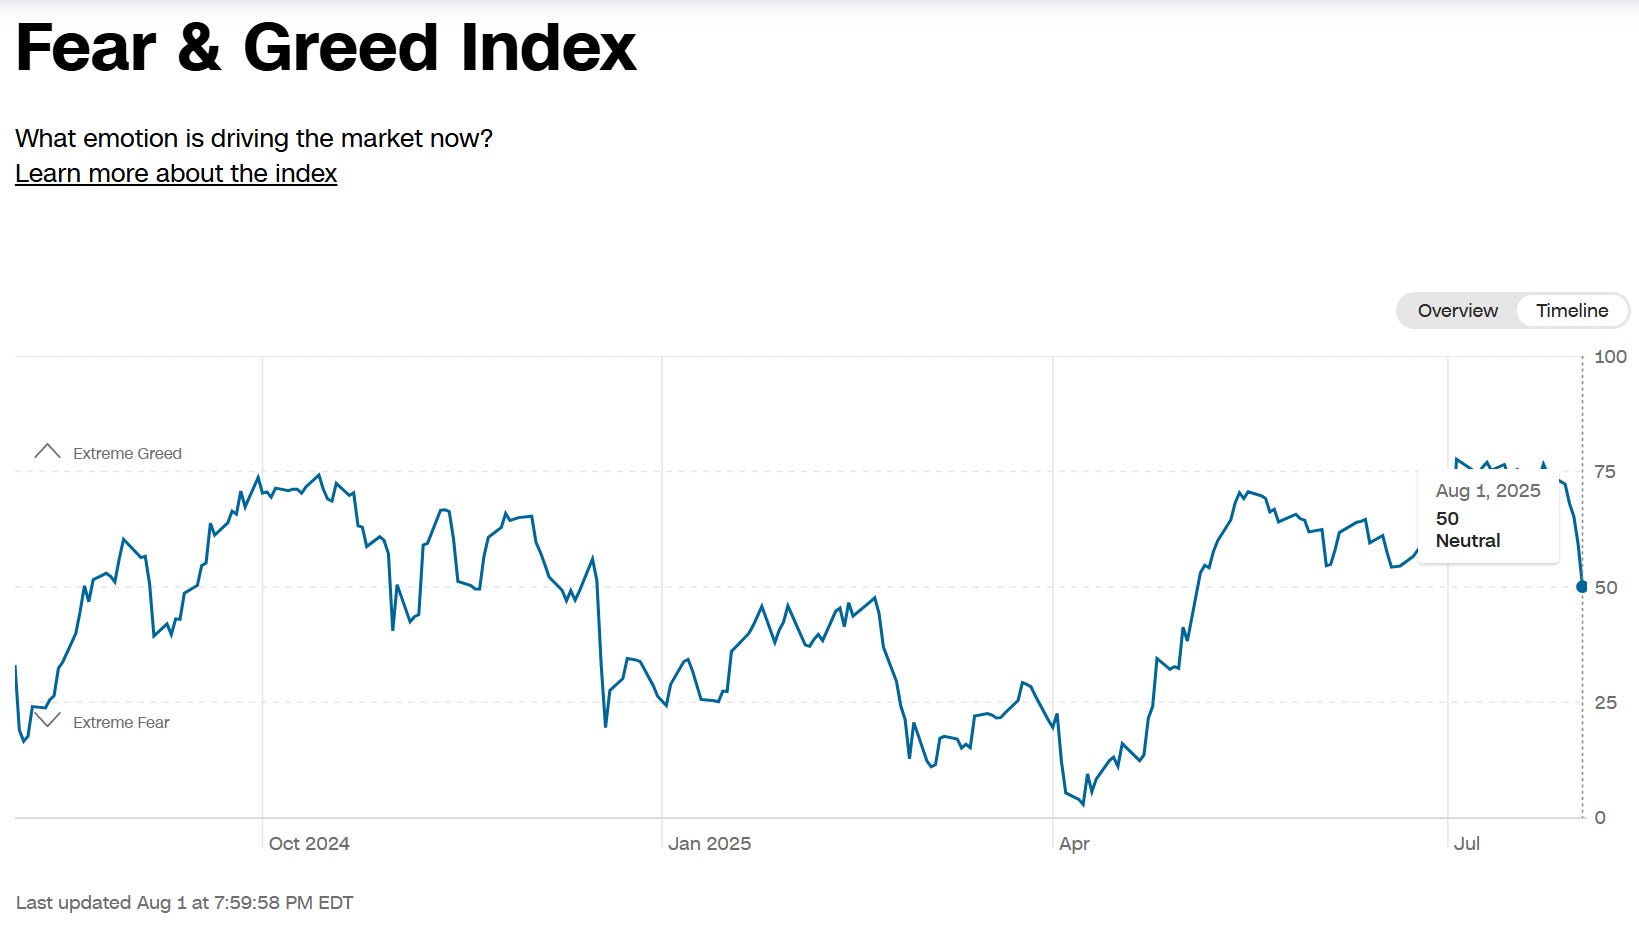
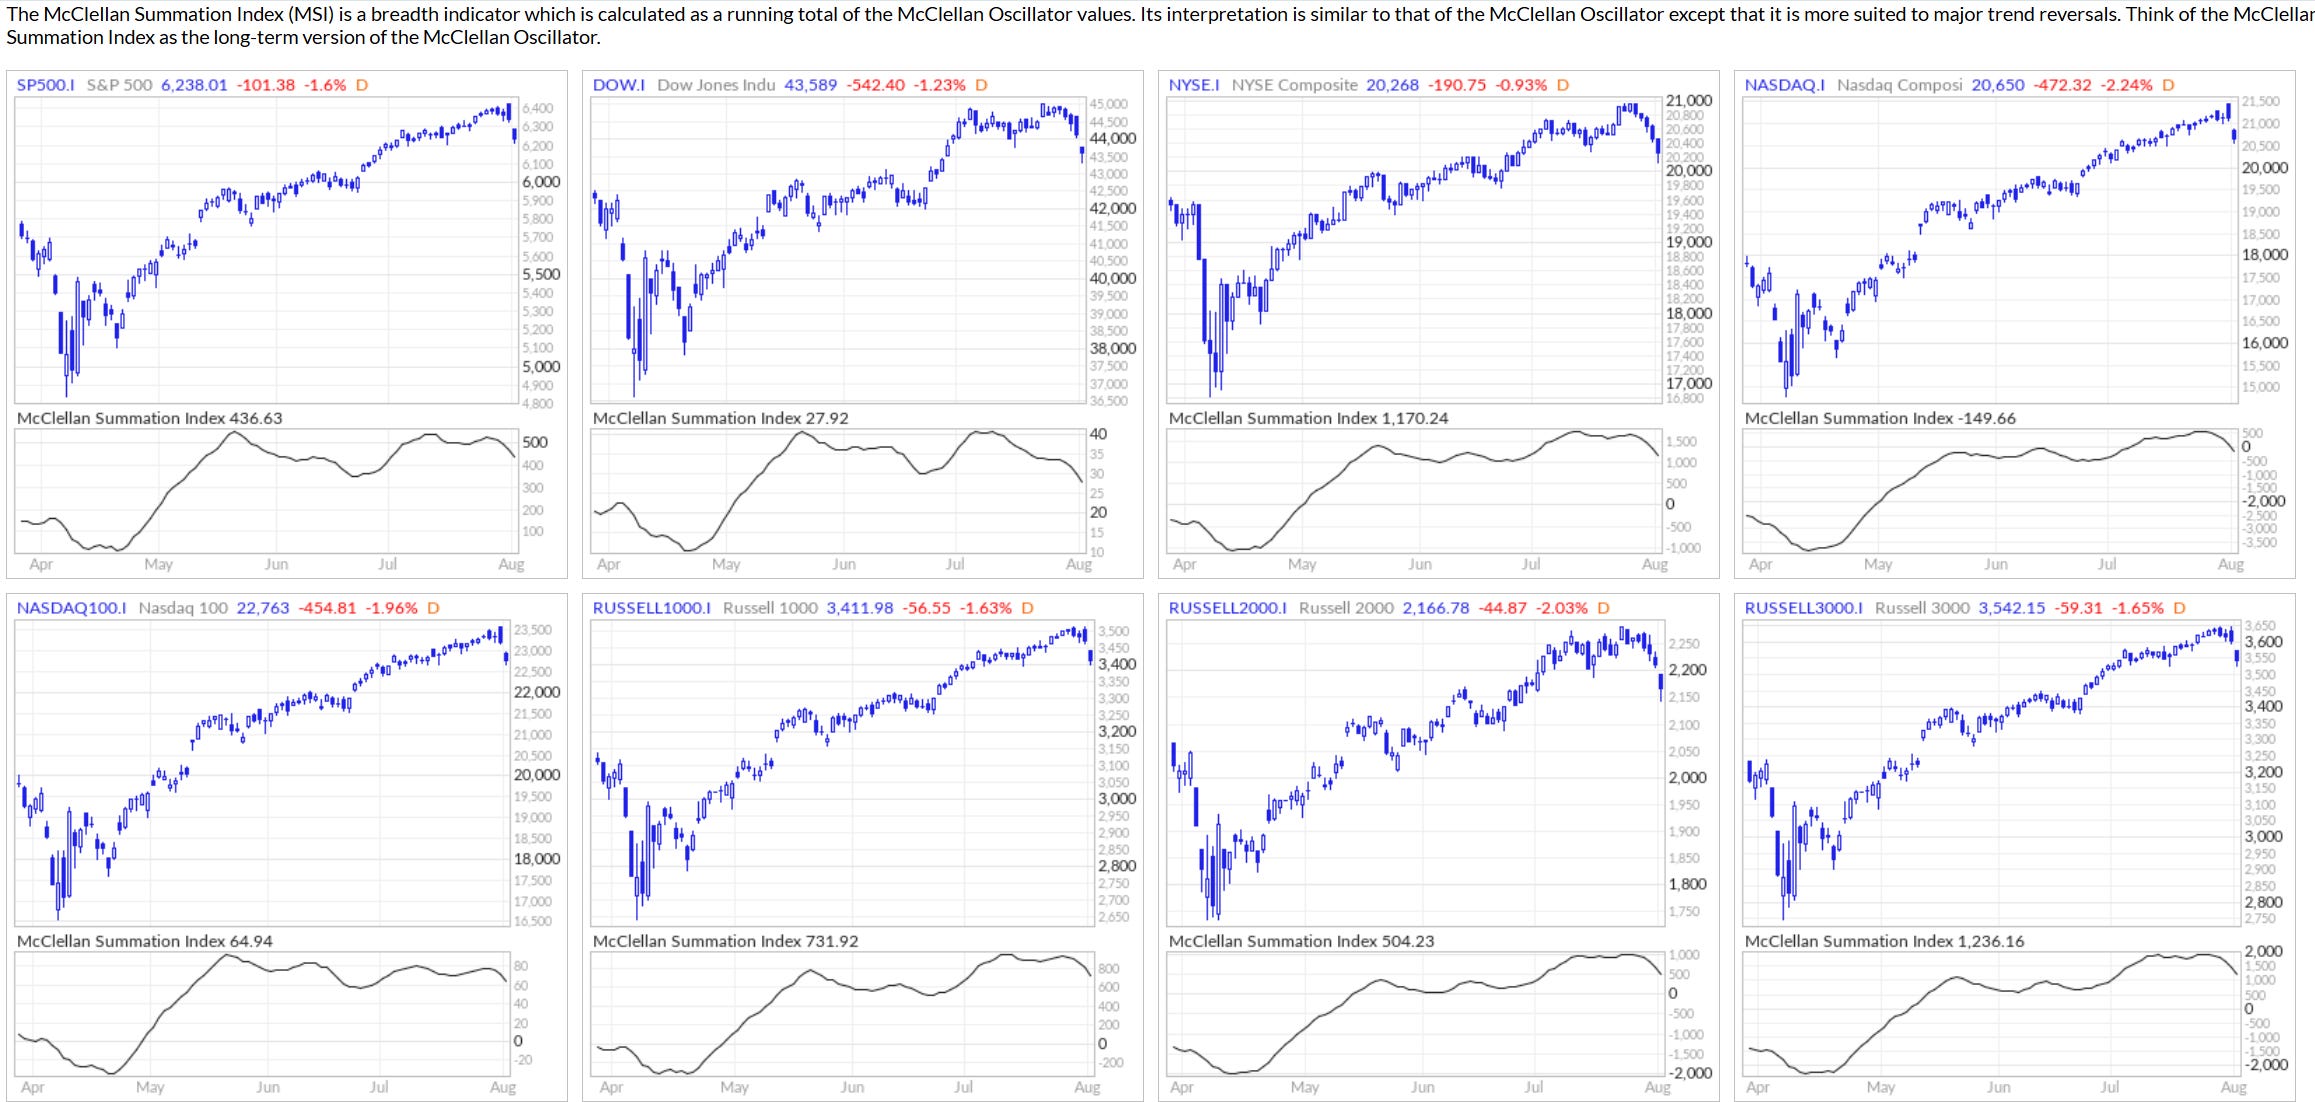
McClellan Oscillator—since it’s quite a negative reading expect some relief rally next week
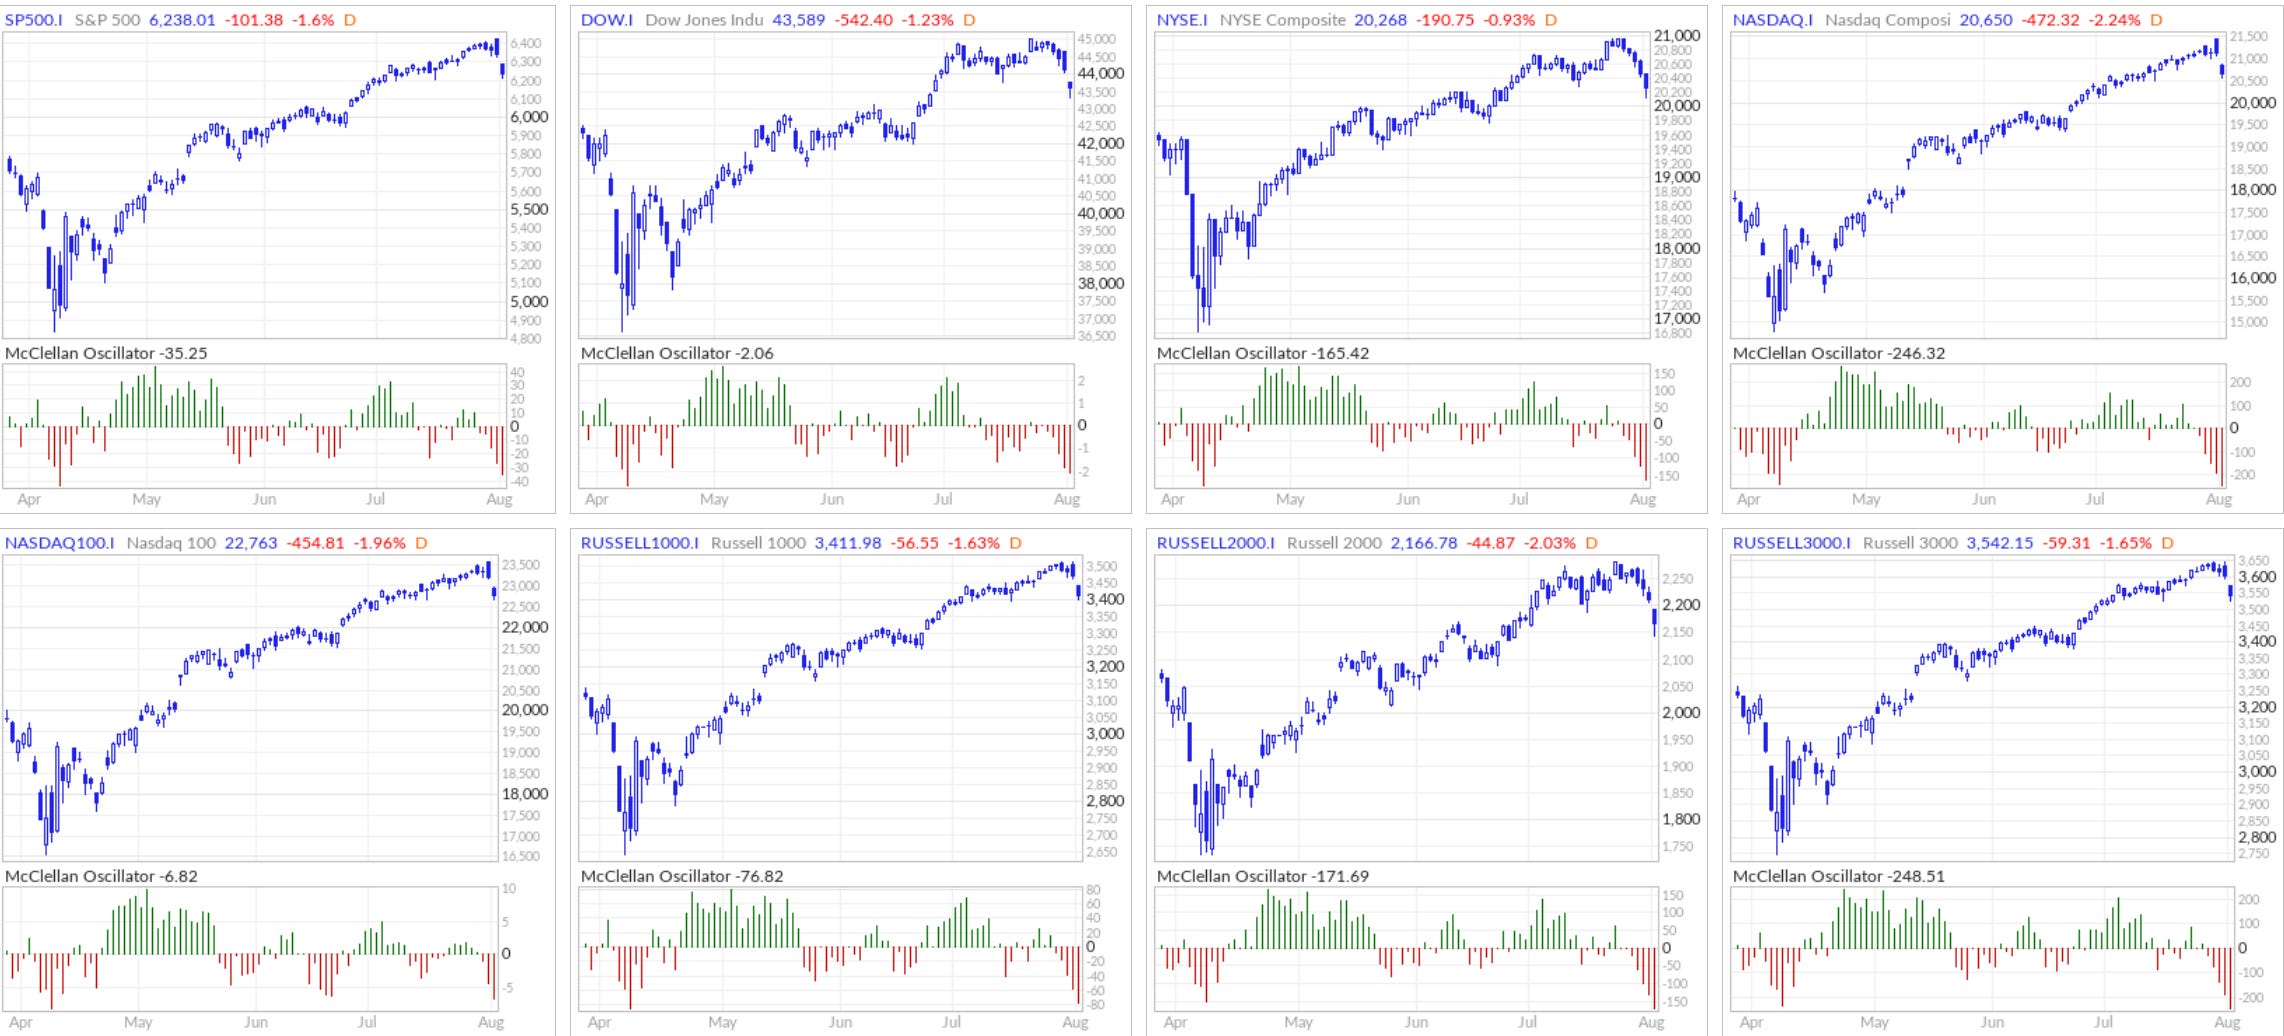
New Highs - New Lows—quite a sharp decline which is why a relief rally is likely then retest will probably fail and we see more downside
McClellan Summative Index—this is a bearish reading given the technicals
*This my personal blog and is not investment advice—I am not a financial advisor but a random person on the internet who does not have a license in finance or securities. This is my personal Substack which consists of opinions and/or general information. I may or may not have positions in any of the stocks mentioned. Don’t listen to anyone online without evaluating and understanding the risks involved and understand that you are responsible for making your own investment decisions.
US Stock Market PE ratio of 29
The US stock market’s PE ratio now stands around 29, almost double its long-term average of 15–16. This high valuation signals that investors are paying top dollar for a slice of future profits, leaving little margin for error. Historically, when the market’s PE has soared to these levels, the risk of a sharp correction rises significantly. That’s because any negative surprise, whether it’s weaker earnings or a souring economic outlook, can trigger a re-pricing where stocks rapidly fall back in line with more grounded fundamentals based on the data.
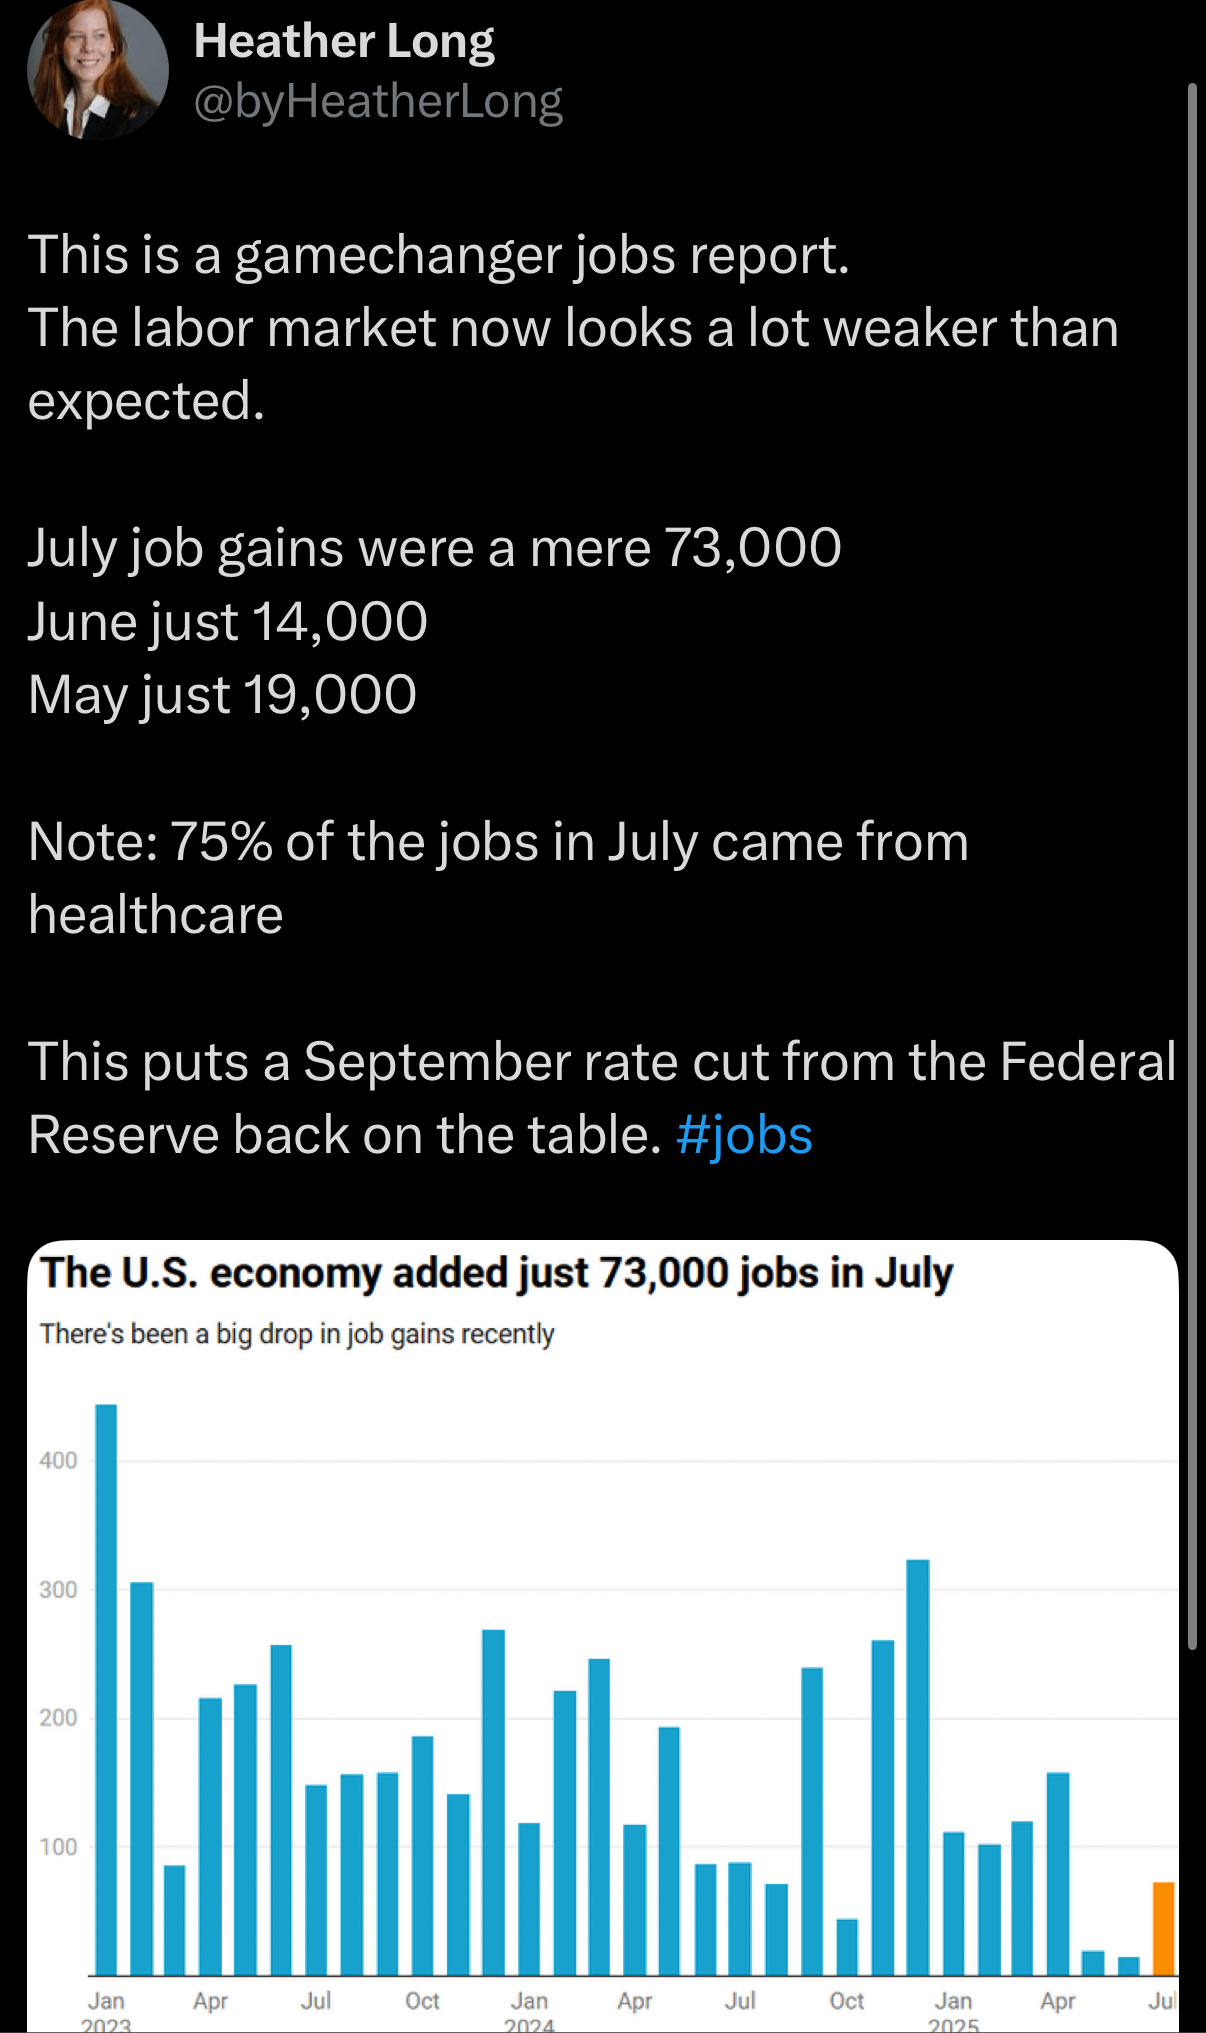
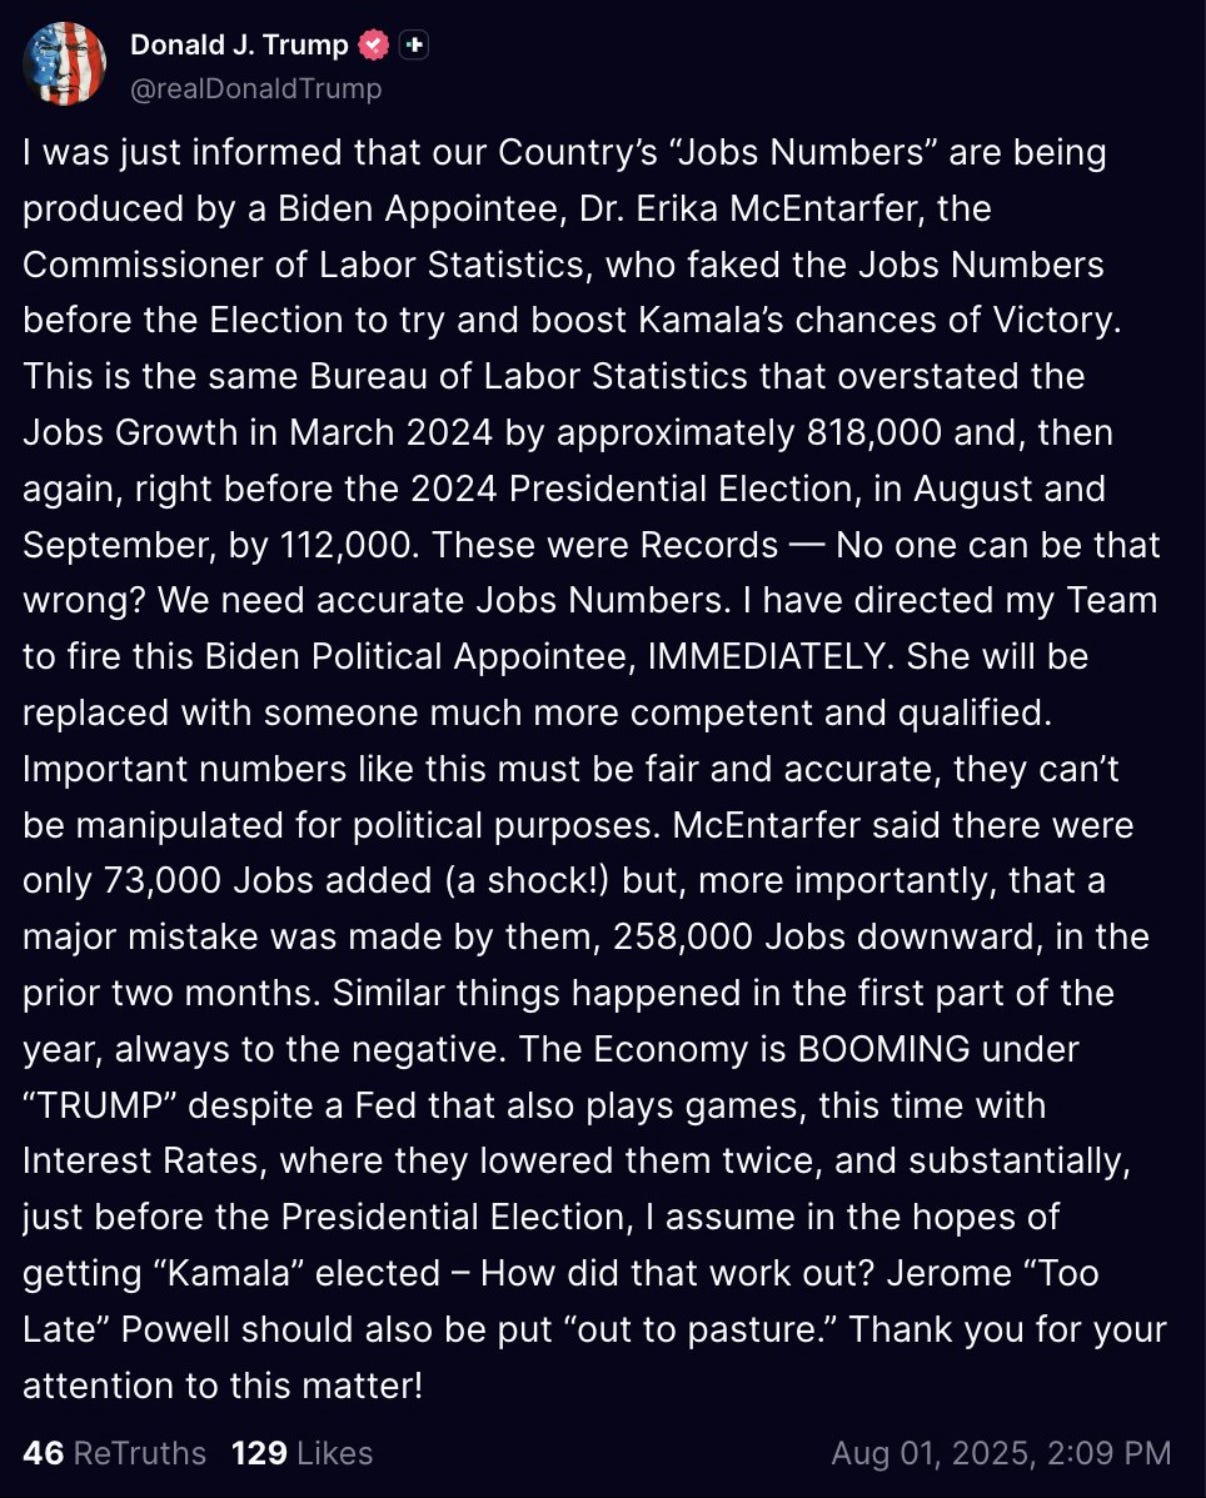
Based on the July jobs report (especially the abnormally large revisions), I believe the stock market’s optimism will start to fade.
The Jobs Report: Revisions saw -258,000 jobs
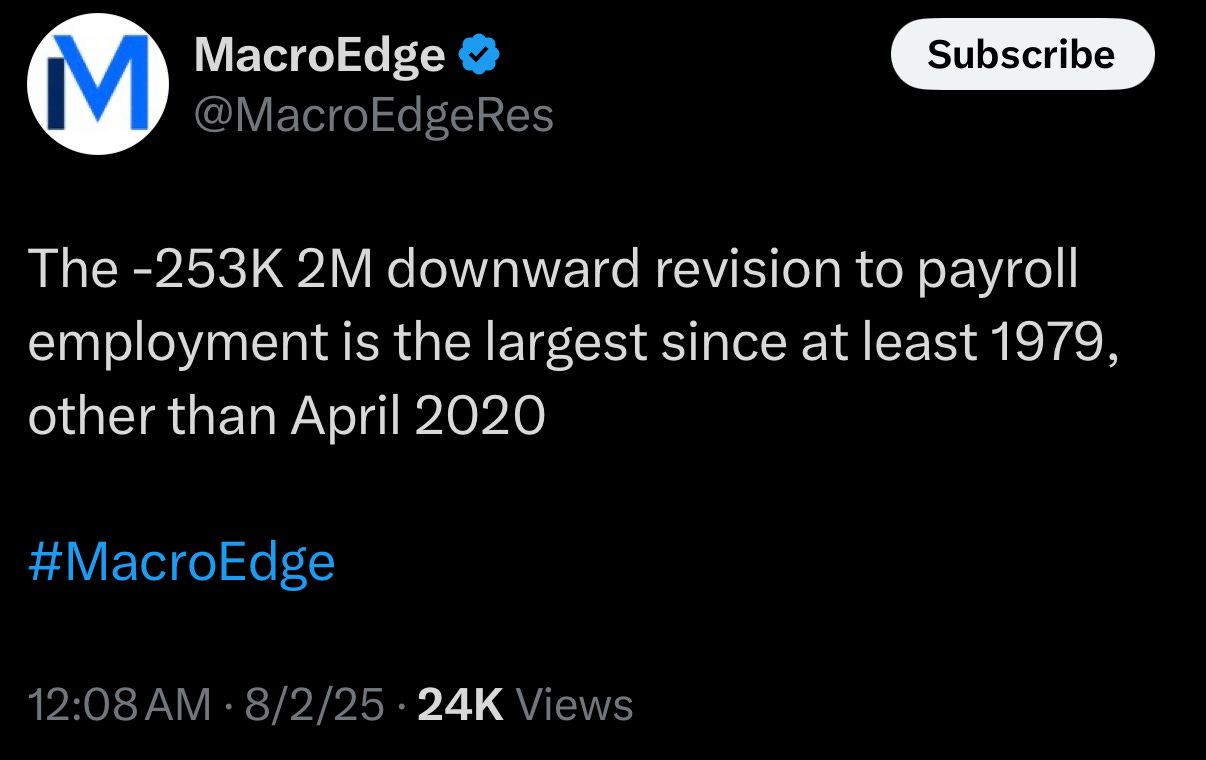
This is a concerning jobs report since the May 2025 jobs gain was revised down by 125,000, from a previously reported +144,000 to just +19,000. And the June 2025 gain was revised down by 133,000, from +147,000 to +14,000.
A combined downward revision of 258,000 jobs over two months is substantial and raises concerns about the underlying health of the labor market that the initial numbers had overstated (that the market priced in as we went to ATHs after ATHs).
The unemployment rate also edged up to 4.2%.
Trump is also a big risk factor
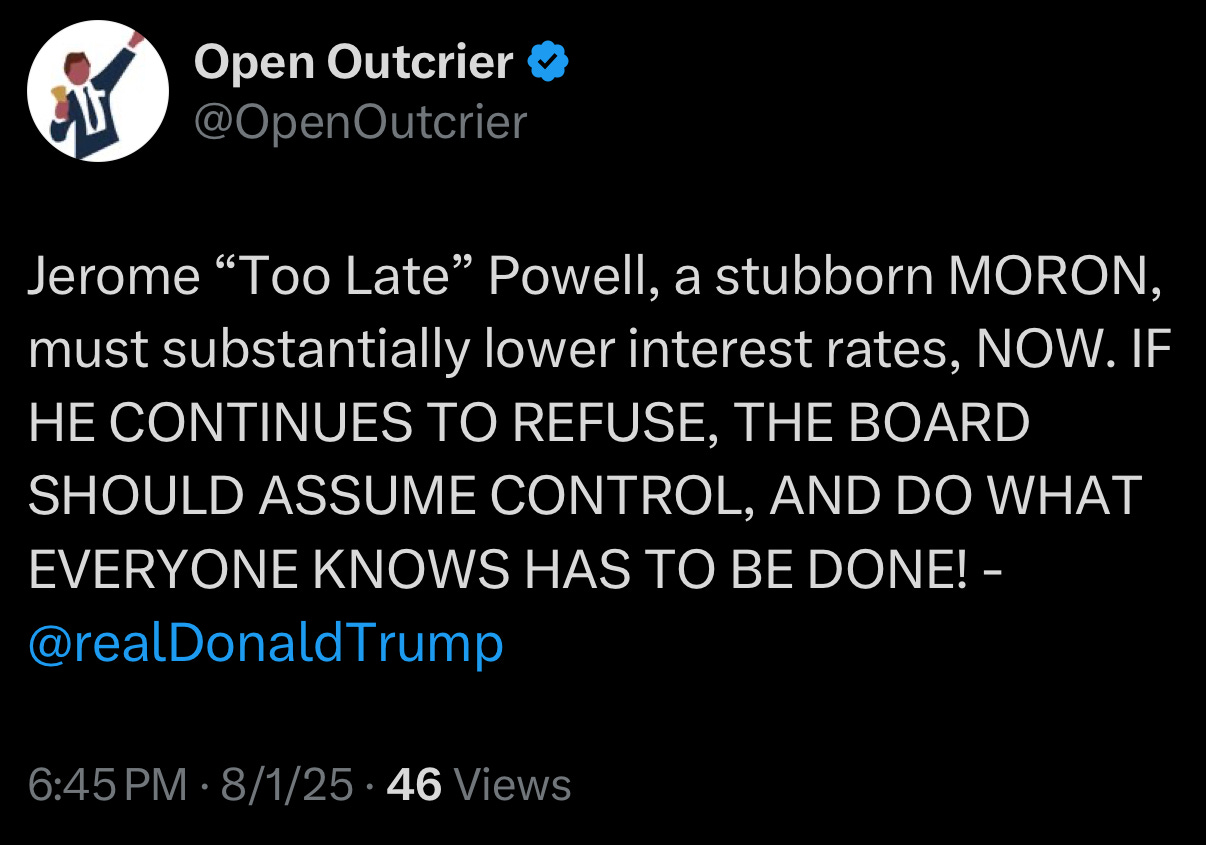
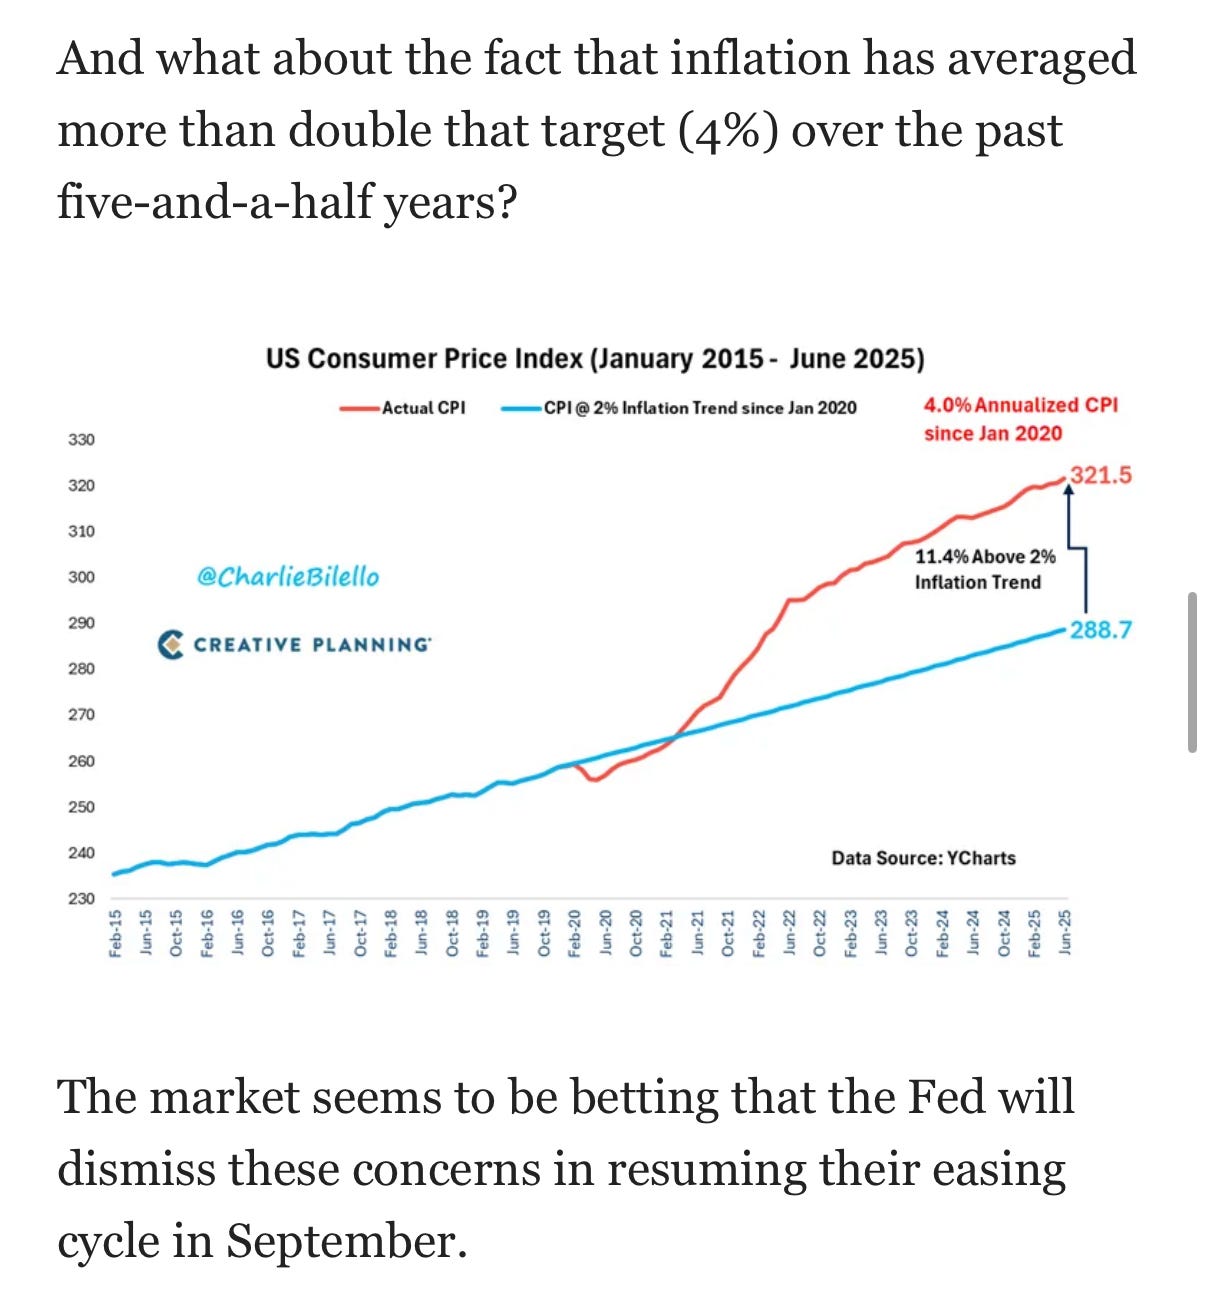
CPI isn’t convincingly back down to 2.0% yet either
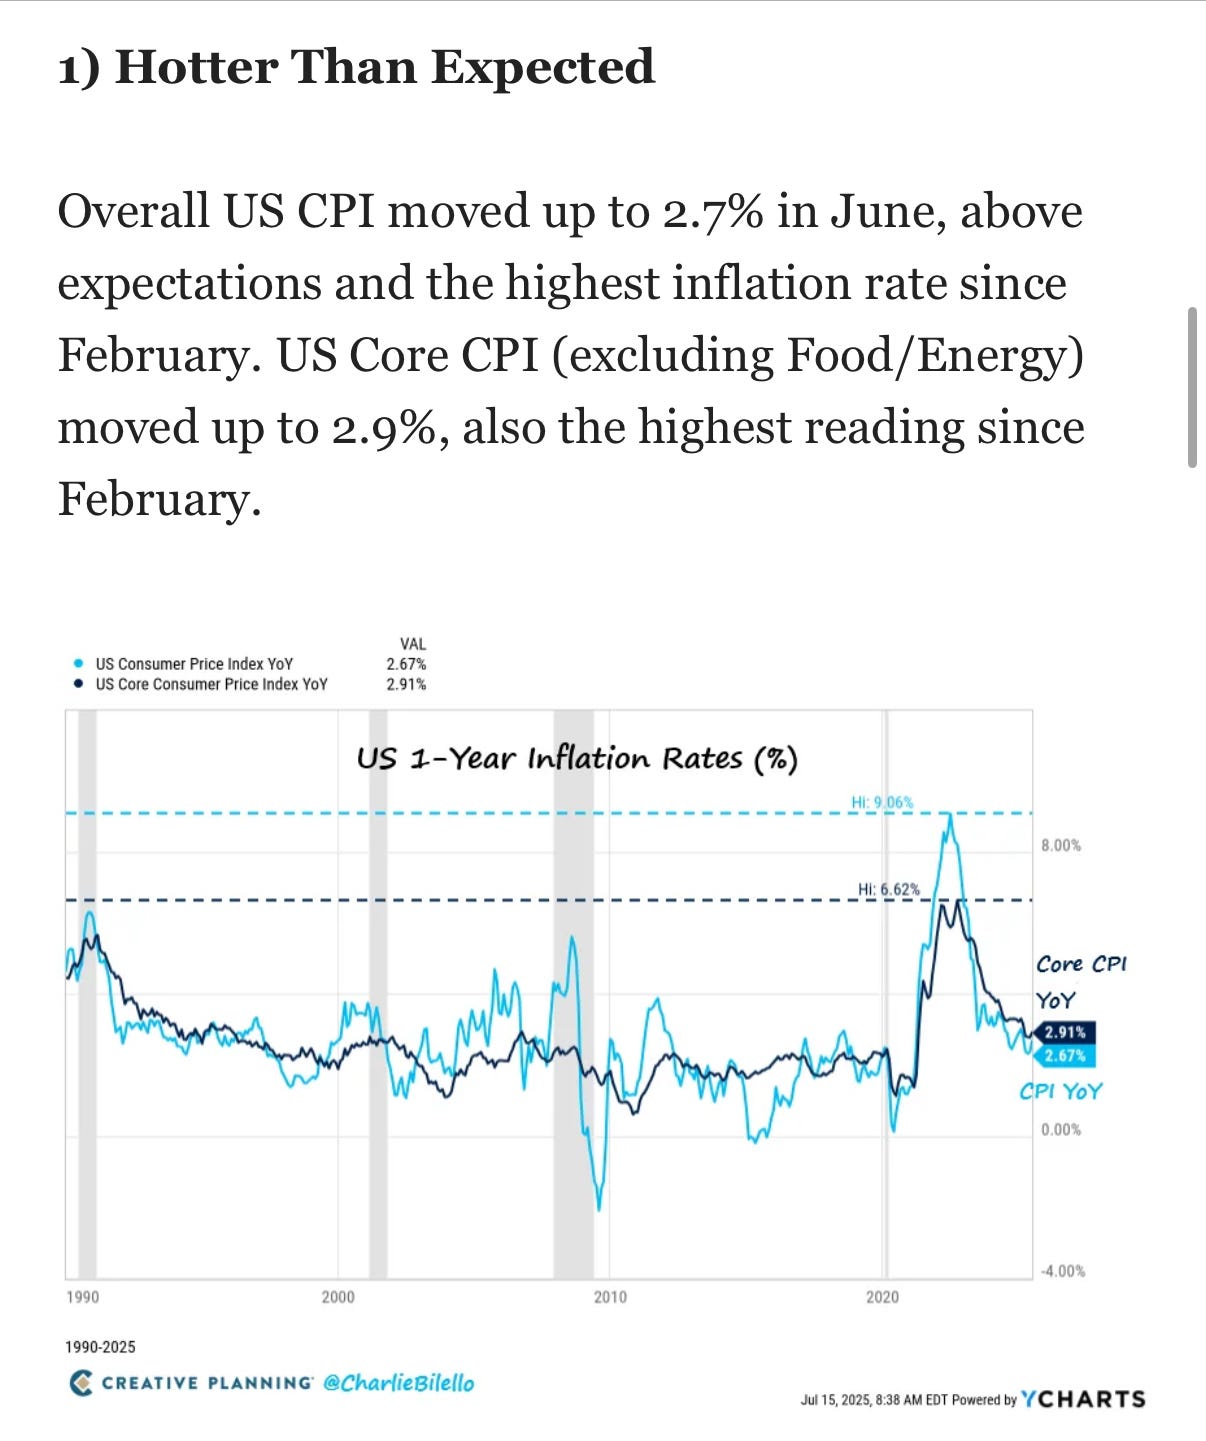
Inflation continues to plague the average American and this will become a louder and louder political flashpoint for Trump and his MAGA base
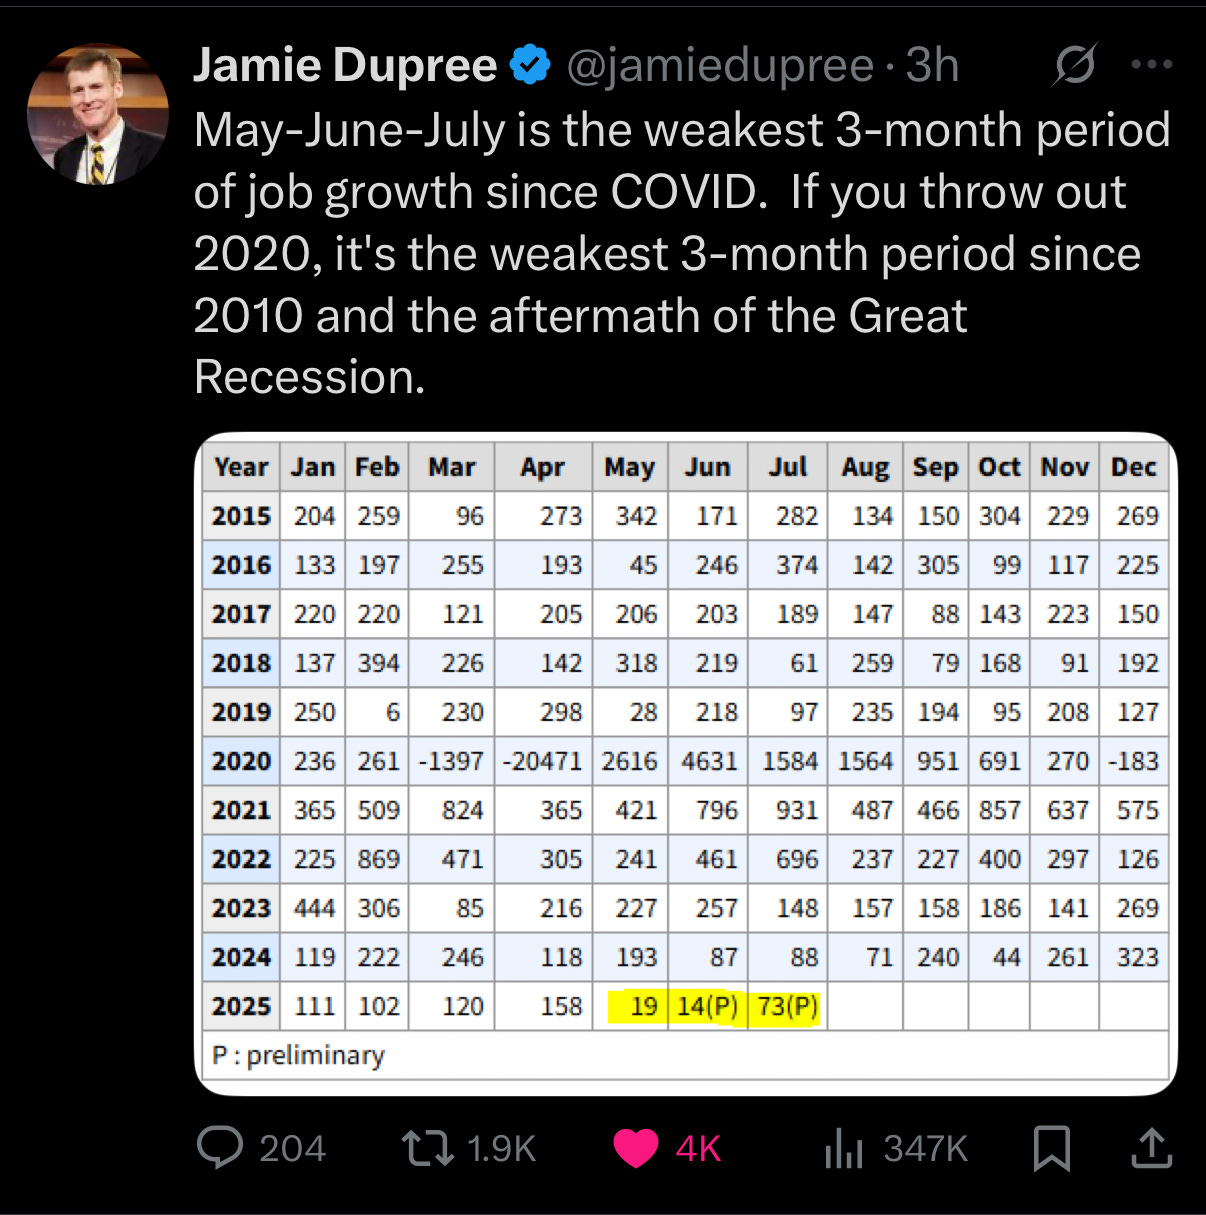
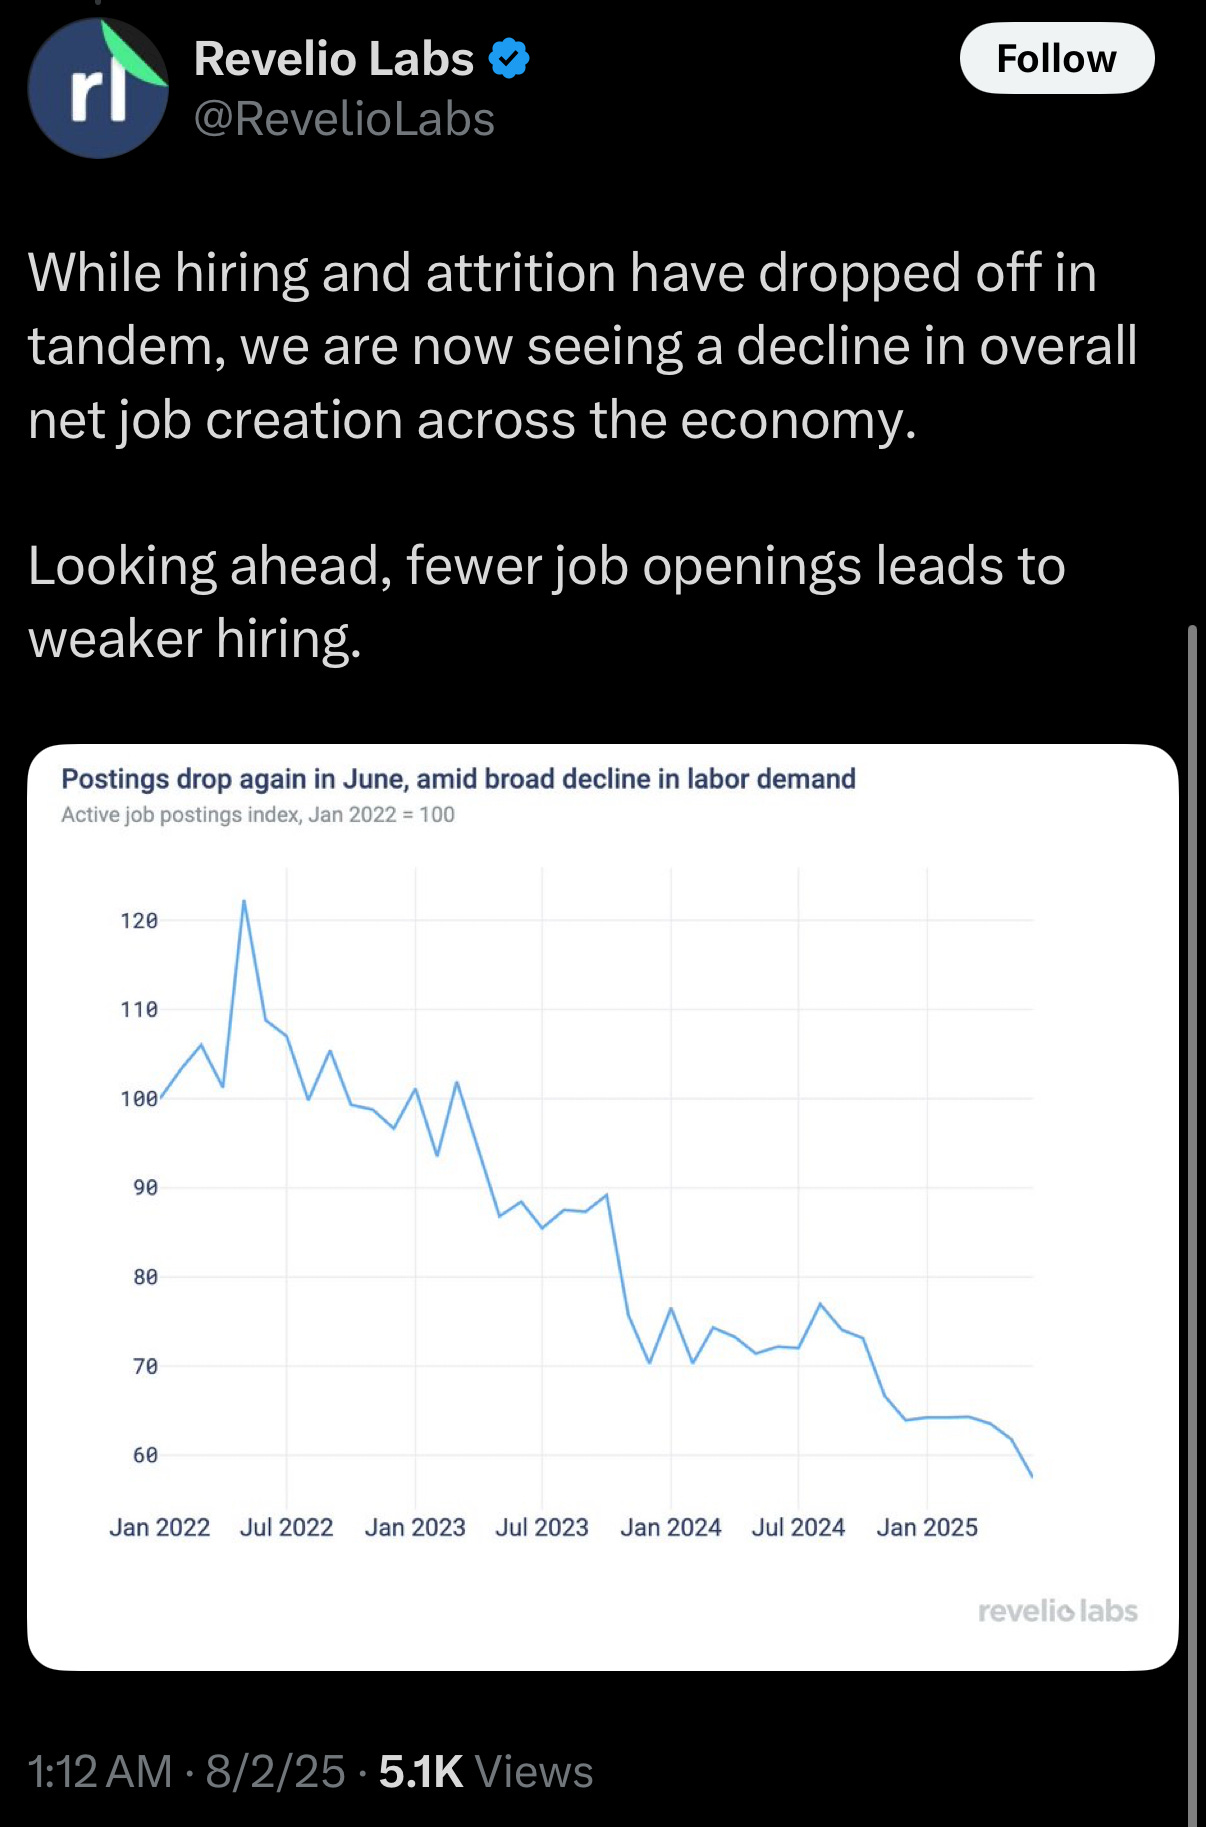
Job creation continues to decline
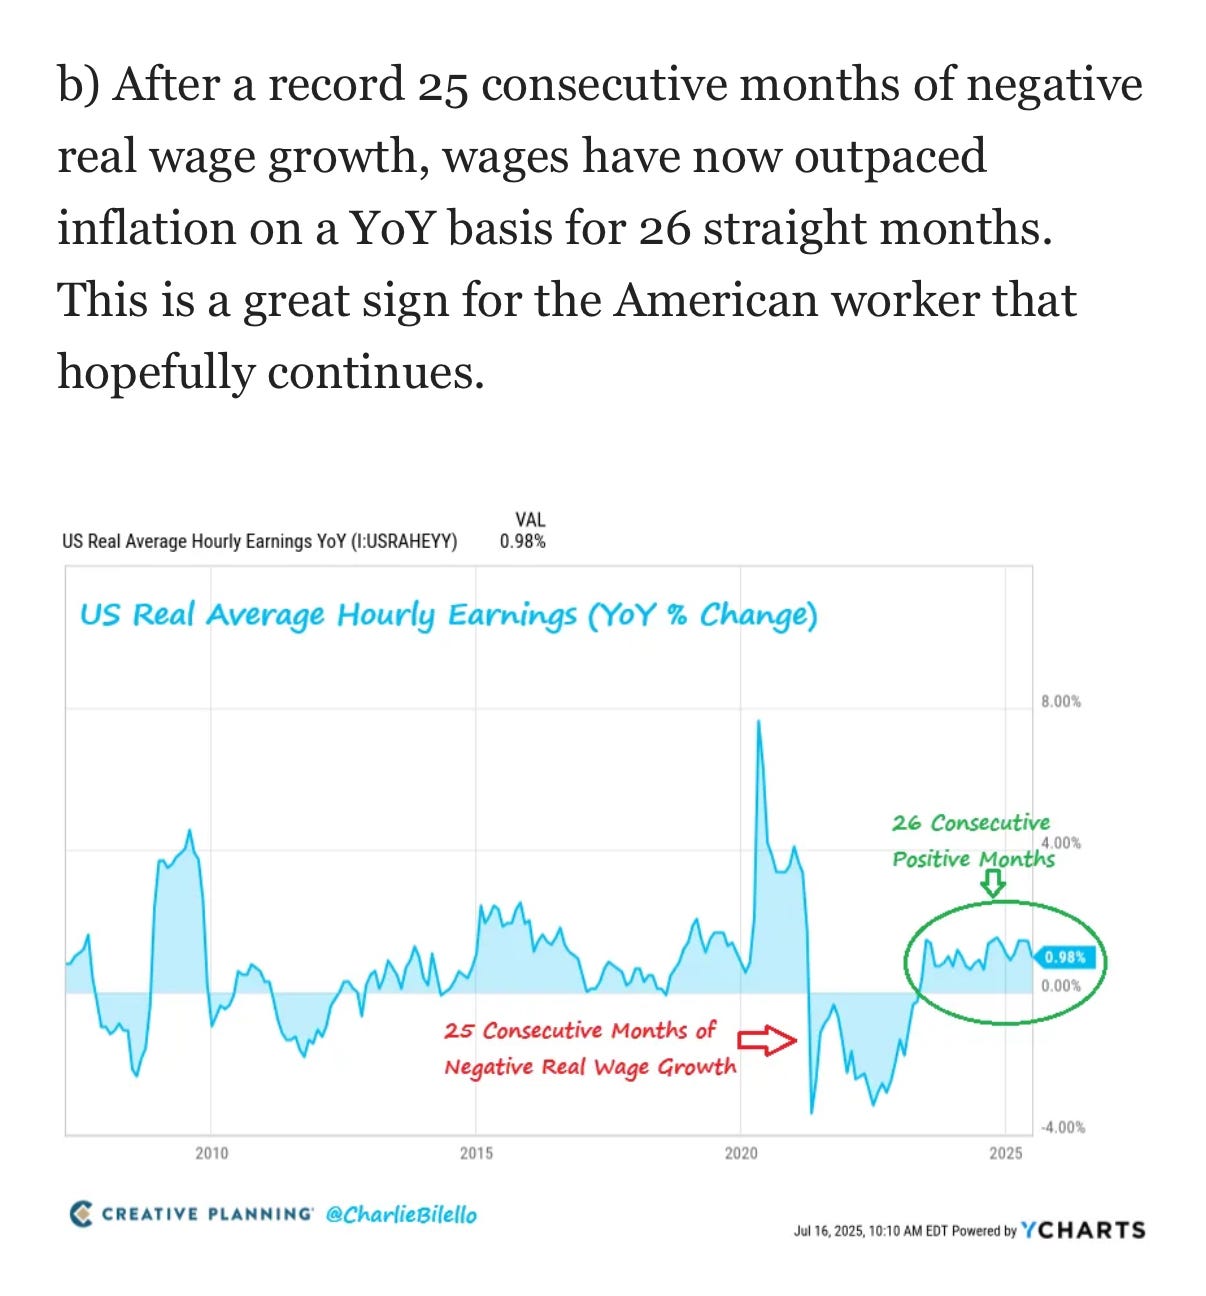
One data point that’s bullish is how wages continue to outpace inflation. This is a “north-star” data point and long-term bullish making every dip a buy opportunity.
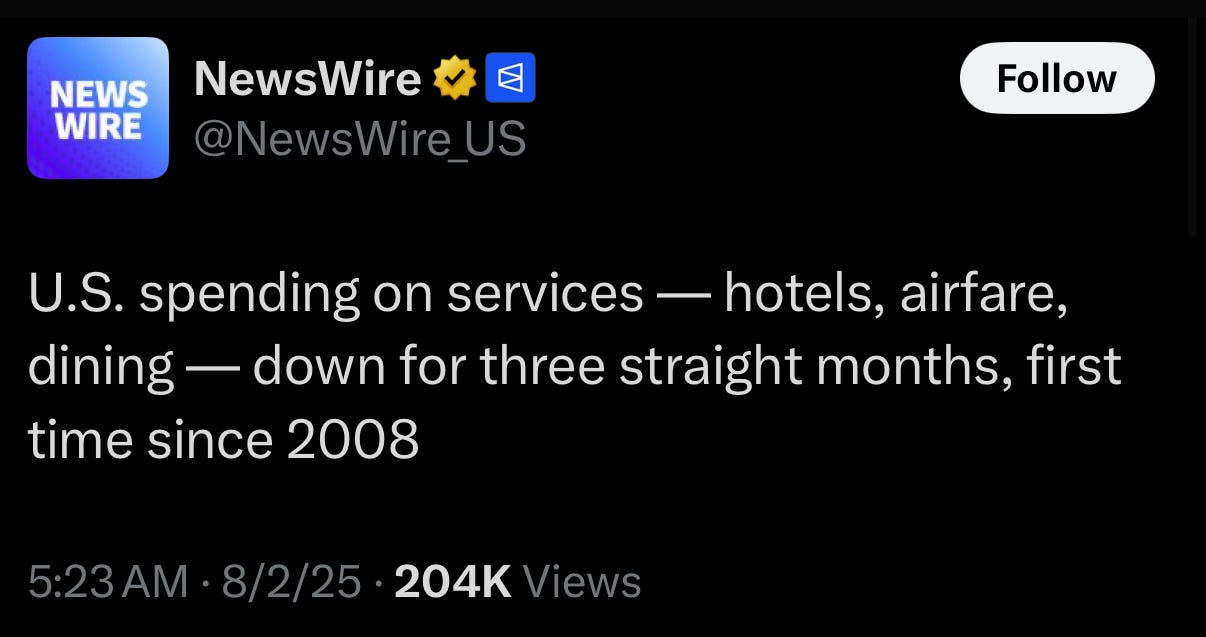
However, wage growth can start to stall as demand and spending falls: spending on services is down for 3 straight months
Tourism is also falling (no thanks to ICE and Border police negative news stories of all these tourists getting detained, etc.)

Interesting observations below
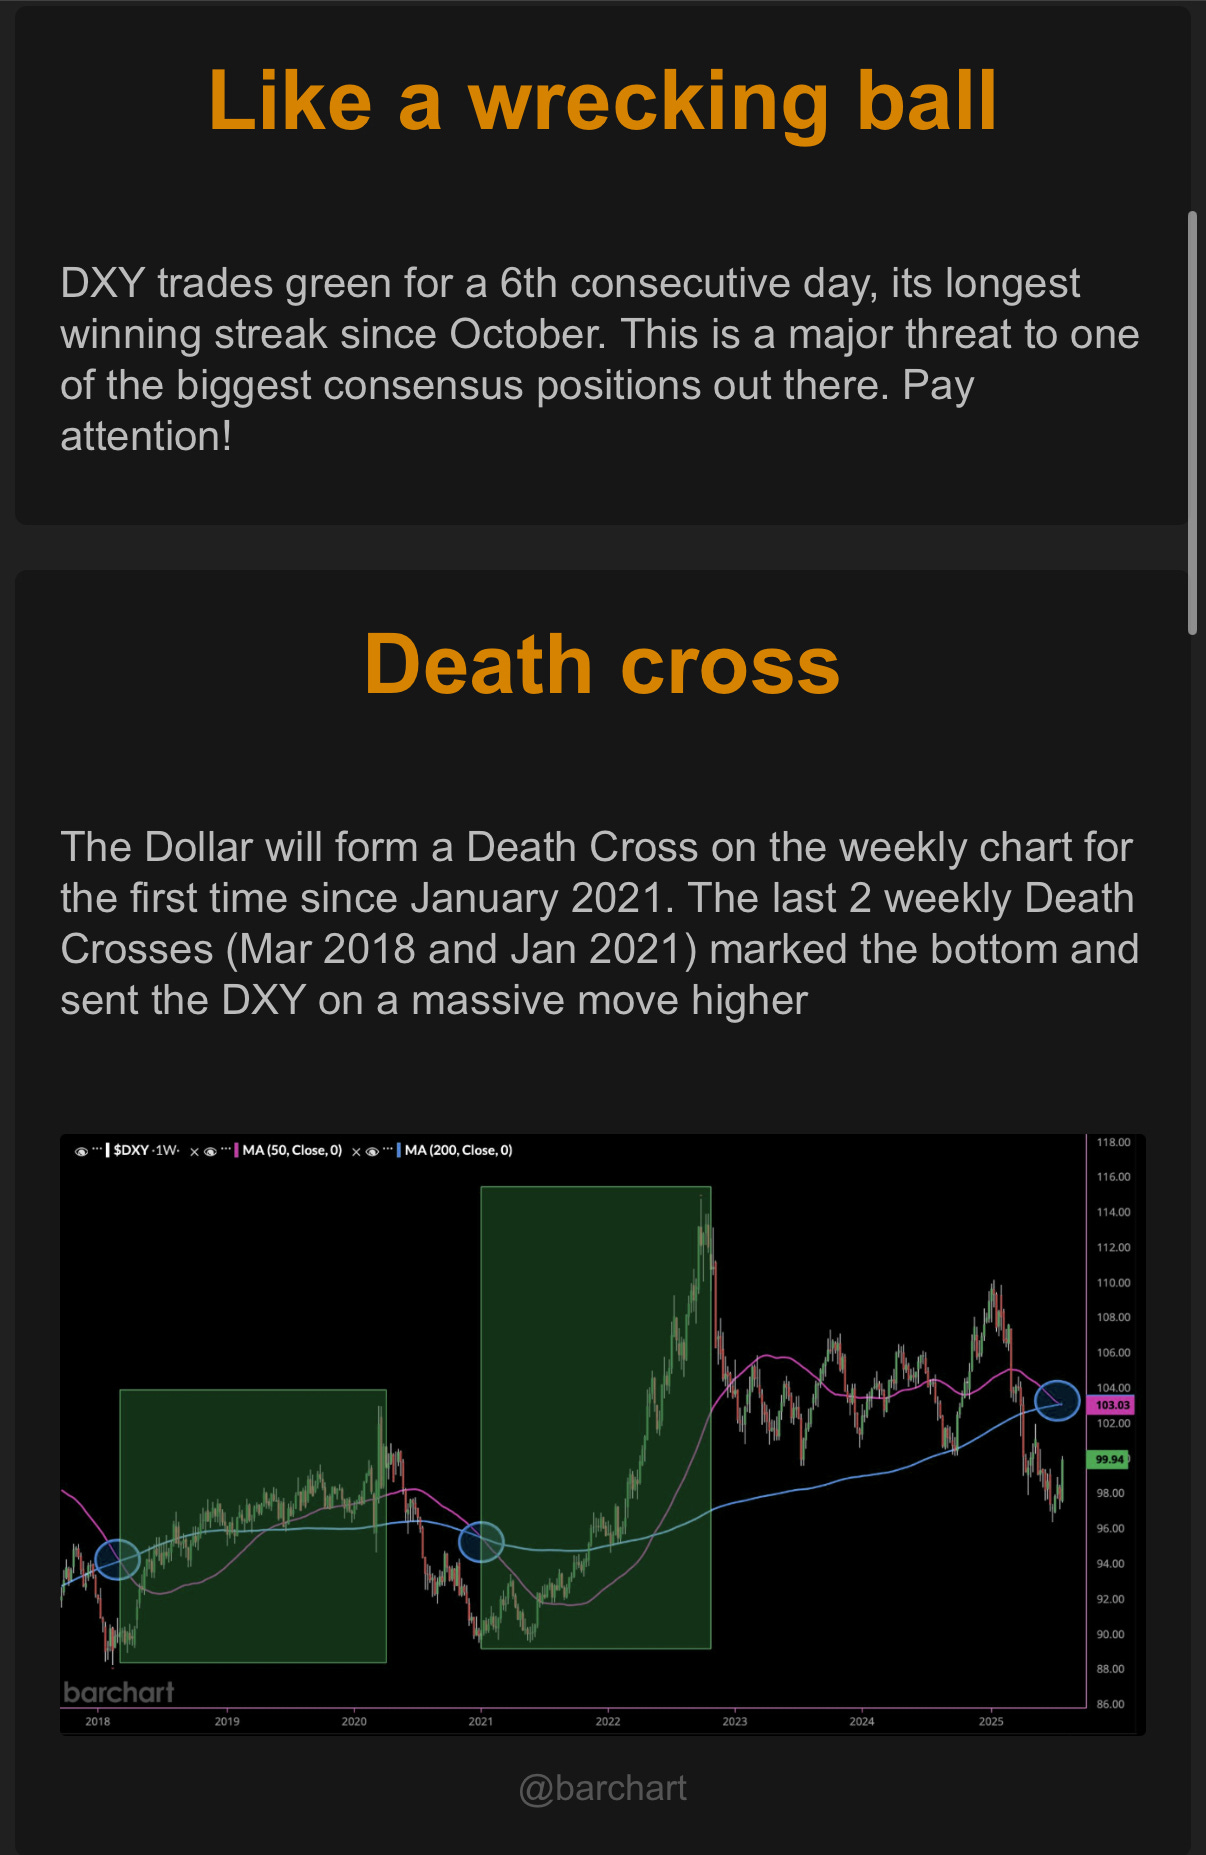
A rising DXY is bearish—recall that my bullish thesis months ago was based on how the DXY was falling, which would be bullish MNCs (multi-national corporations), etc.
The Tariffs Lag Effect
GDP 3% was mostly the surge in imports where businesses (like my company) did to front run the tariffs which caused a massive boost to GDP.
If you look closer at the data around consumer consumption, employment report, and sticky inflation, the macro narrative is now starting to sound more negative.
Keep reading with a 7-day free trial
Subscribe to Best of Twitter/Threads, Analysis & Forecasts to keep reading this post and get 7 days of free access to the full post archives.