Weekend Analysis: FOMO Flows > Macro (for now)
Fear is the most powerful emotion in bear market rallies and sell offs
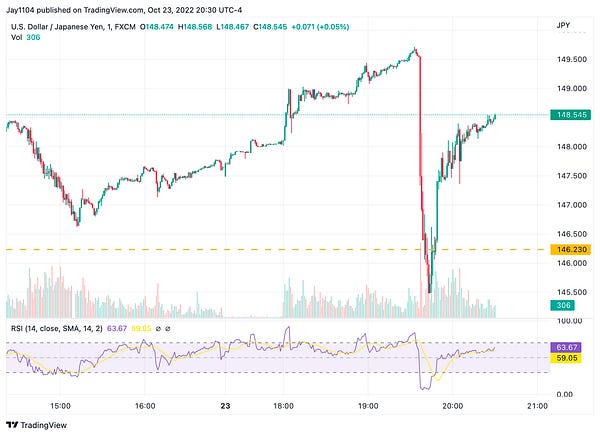
Flows > Macro: note about Friday’s reversal

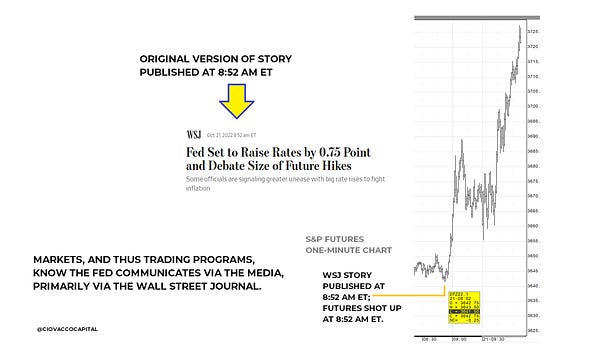
For now, flows > macro and a lot of the negative news and bad macro has been mostly “priced in”. What will drive short term prices is flows and fear—but not the fear of falling prices, the other fear called FOMO. We’ll have a fear of missing out on a potential rally—especially if the market narrative is about how inflation has peaked given data showing decline in prices (housing, commodities, shipping rates, almost no port congestion, higher inventories, etc.).
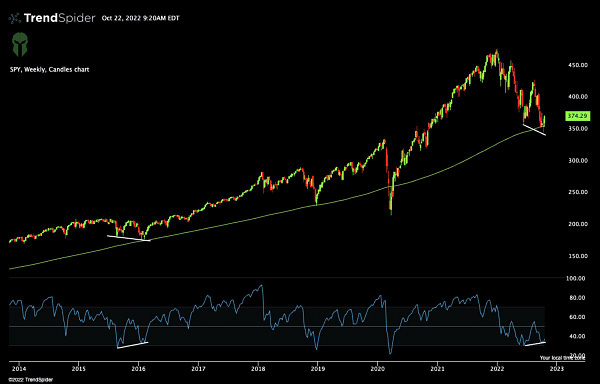
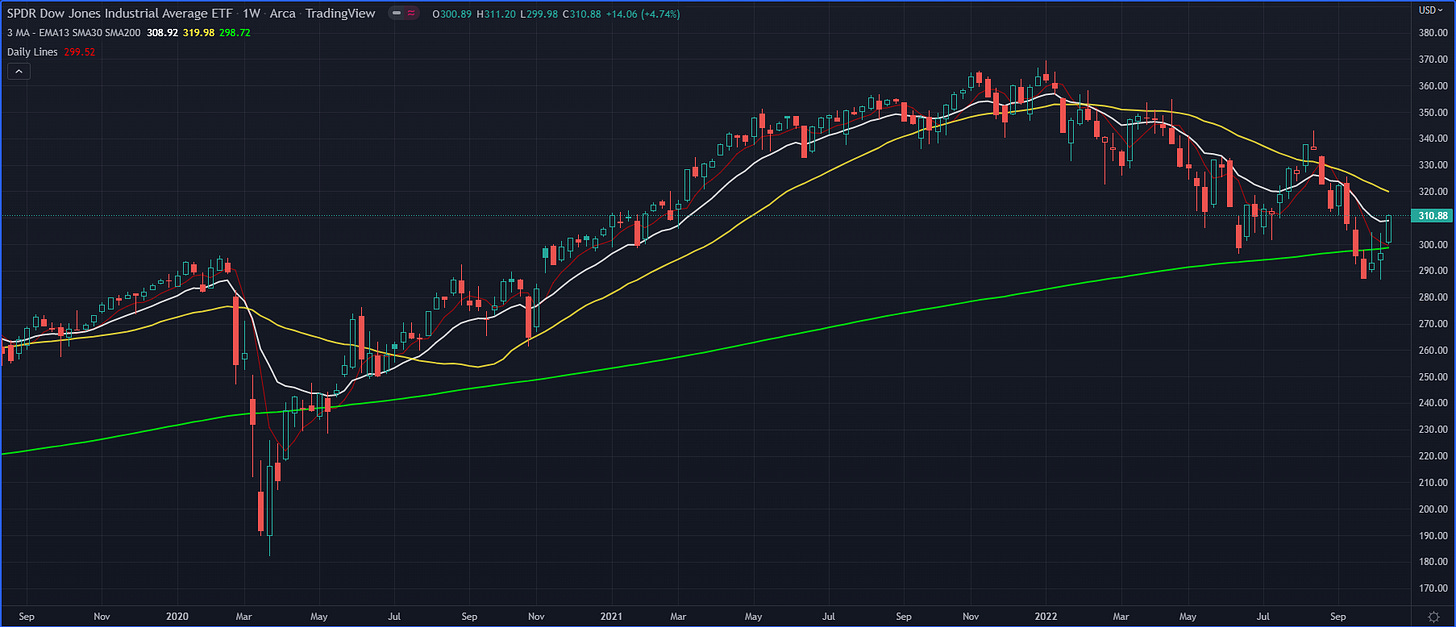
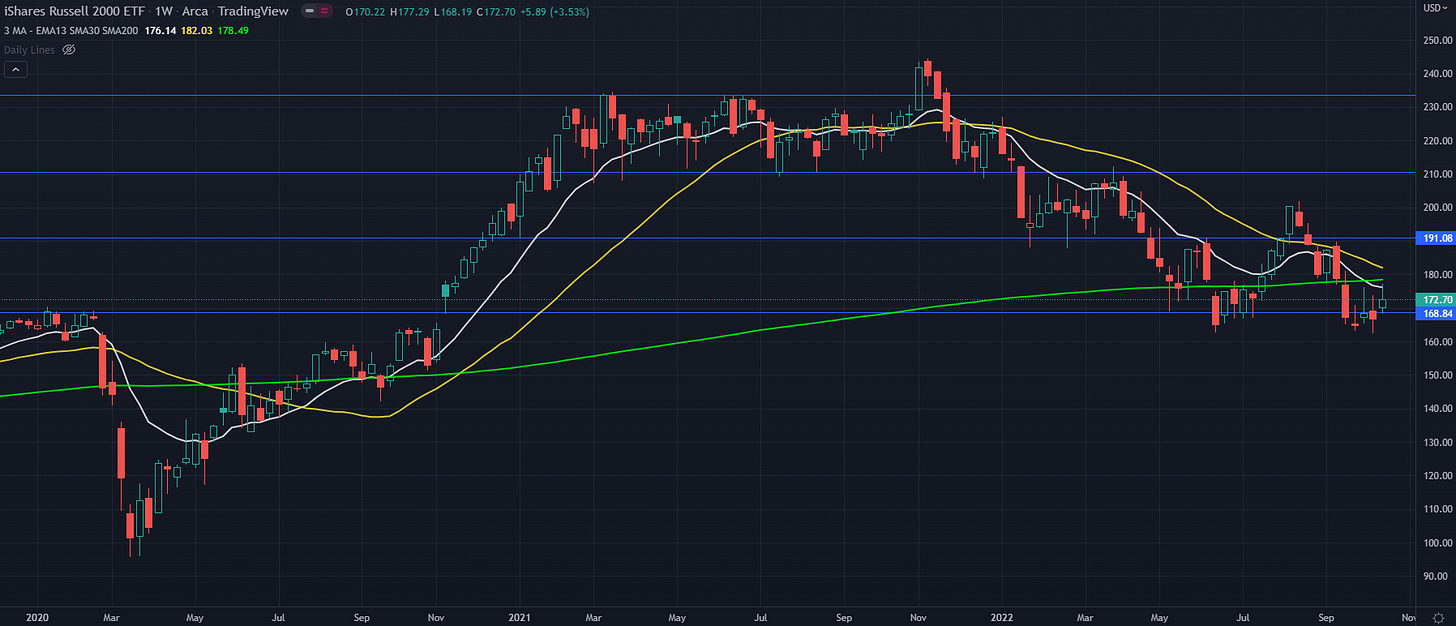
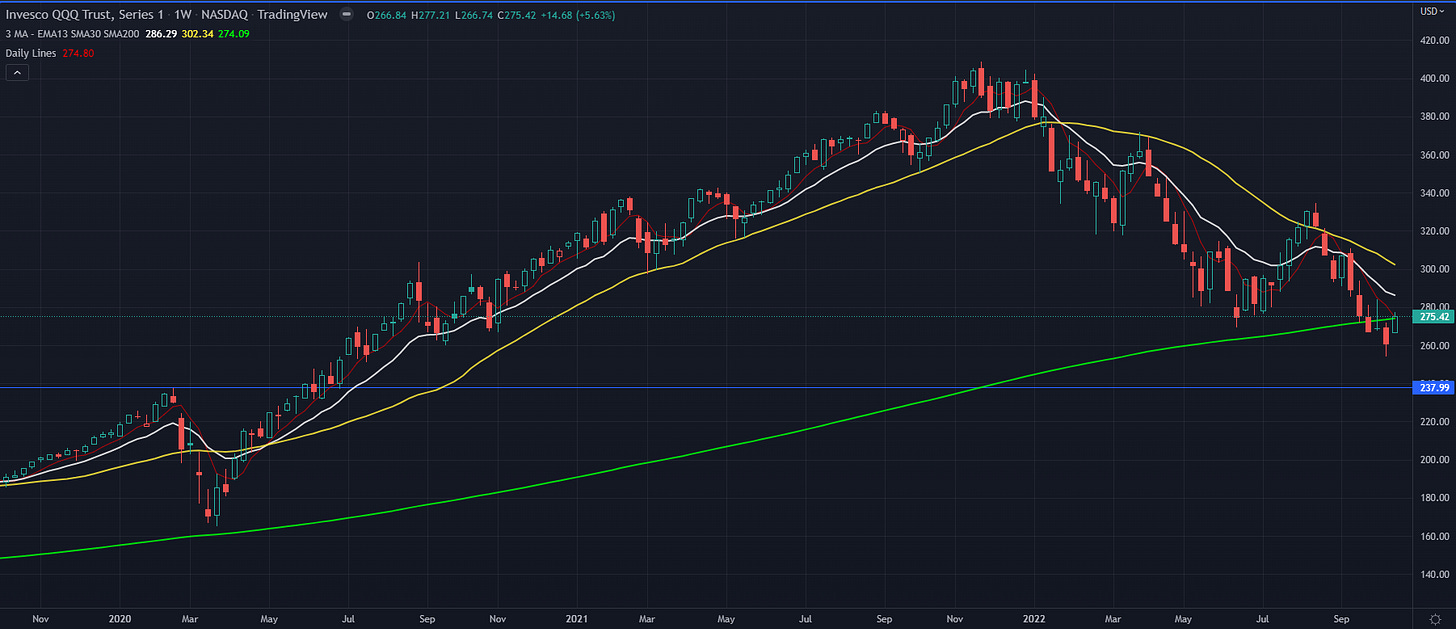
How high can things go? Up to retest SPY 0.00%↑ daily MA200 which is around 409—this is where the August bear market rally rose up to and rejected. This is likely given end of year bullish seasonality—but this time could be different, it’ll depend on no major earnings surprise to the downside.
The Bullish View 🐂
The technical and flows are bullish: Daily and weekly RSI shows bullish divergence
The consumer is resilient: consumer spending remains strong and they have the money to spend and major companies earnings have been optimistic: Consumer Staples: PG 0.00%↑ , JNJ 0.00%↑ , PEP 0.00%↑ ; Tech: IBM 0.00%↑ , NFLX 0.00%↑ , T 0.00%↑ ; Airlines: DAL 0.00%↑ , UAL 0.00%↑ , etc. but some companies were weaker: SNAP 0.00%↑ , VZ 0.00%↑ , AXP 0.00%↑ , etc.
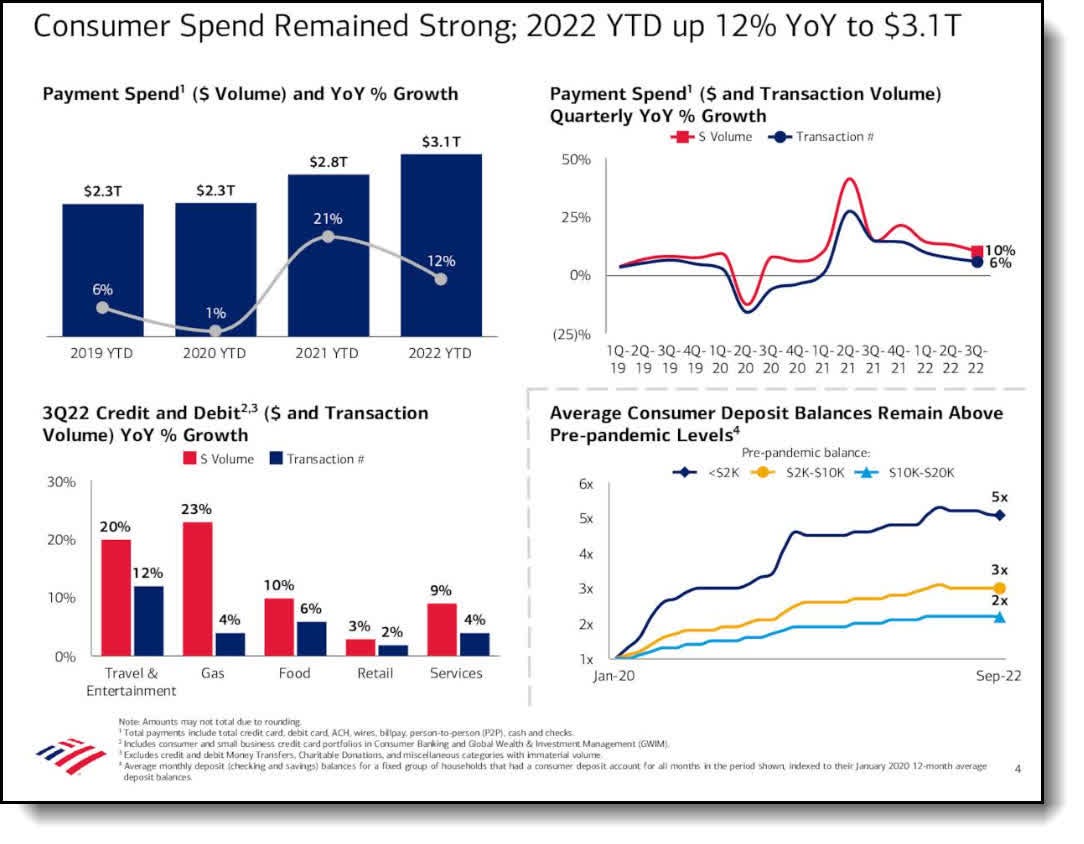
Source: Bank of America earnings 
Source: Yahoo Finance US dollar index: showed 2 weeks of red—which is bullish for equities
SPY broke out of its downward trend that started late Aug
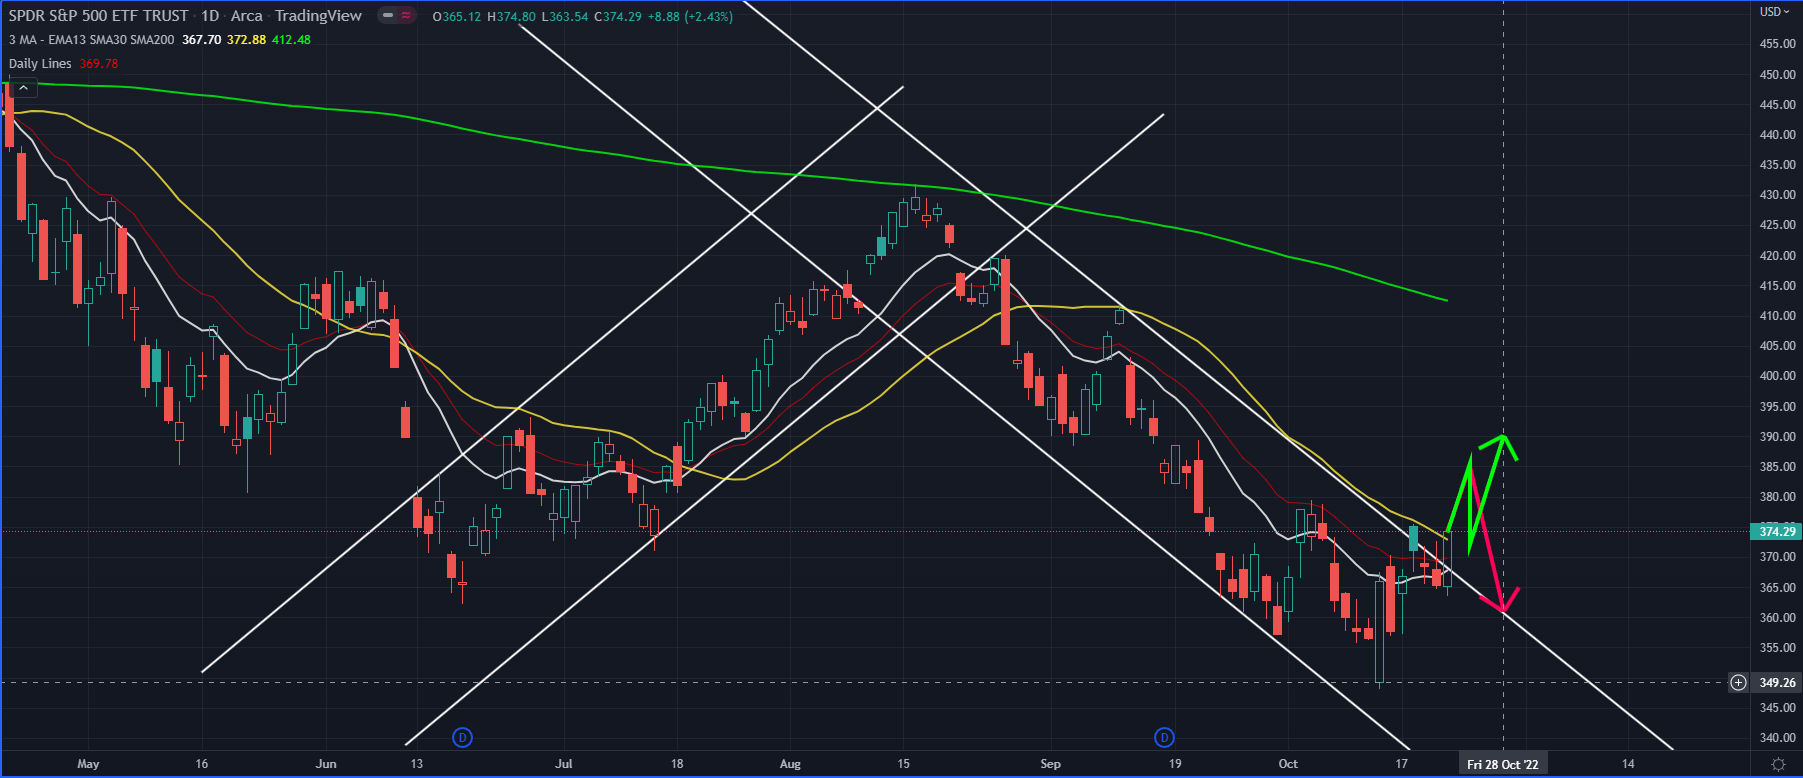
This “things aren’t that bad yet” bear market rally
The bullish data is based on technical levels, extreme fear where the SPY SPY 0.00%↑ fell almost -30% YTD, hopeful “news” that the Fed will slow down or pause rate hikes sooner than expected, earnings aren’t saying a recession is here just yet, to a much needed bounce since we had three red quarters in a row.
The bullish data is not strong and convincing enough for me to say this is the “bottom” and we will resume a bull market trend into 2023. Again, we are only 6 months into tightening of monetary policy where the Fed is aggressively doing double-barreled tightening (raising rates + decreasing balance sheet at the same time).
We didn’t have a Fed raise interest raise this fast since decades ago—compare the steepness of the curve below to previous decades of rate hikes. When was the last time the Fed Funds Rate shot up this quickly?
The last time we saw curves that steep was when we had the high inflation during the 1970s and 1980s. And what followed such steep curves? A recession.
Federal Funds Effective Rate 1955-2022

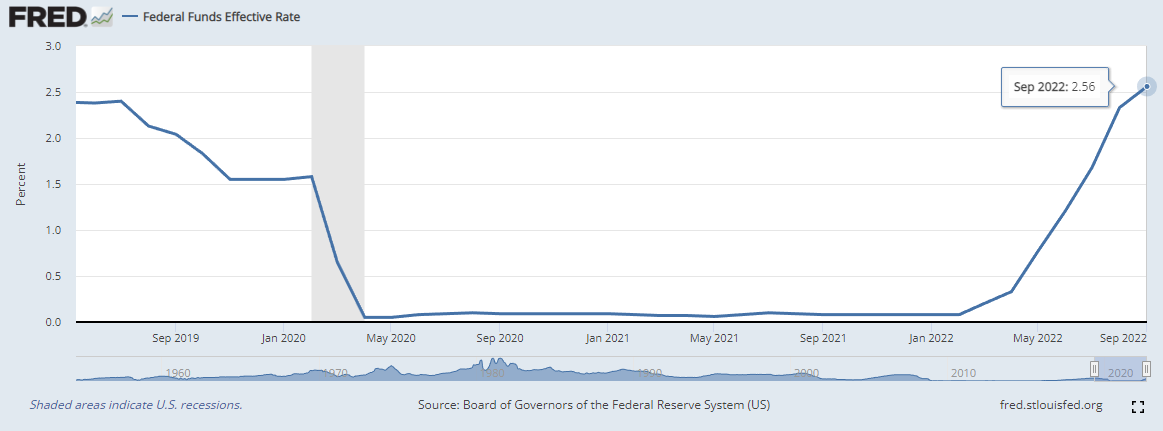
We went from 0.08% in Feb 2022 to 2.56% Sept 2022—that’s in just 7 MONTHS and world economies can’t seem to handle this too well as we see increasing volatility and risks as currency and debt crisis looms.
And we aren’t done yet and going higher towards 4%. In addition, the Fed has just started accelerating QT at 2x the rate. Something is going to break.
The market was basically pumped up on steroids the past two decades on zero interest rates and now we’re trying to rapidly get off that liquidity inducing pump—this can cause a potential crash or aka hard landing on the patient (the economy).
Federal Funds Effective Rate Sept 2019 - Sept 2022
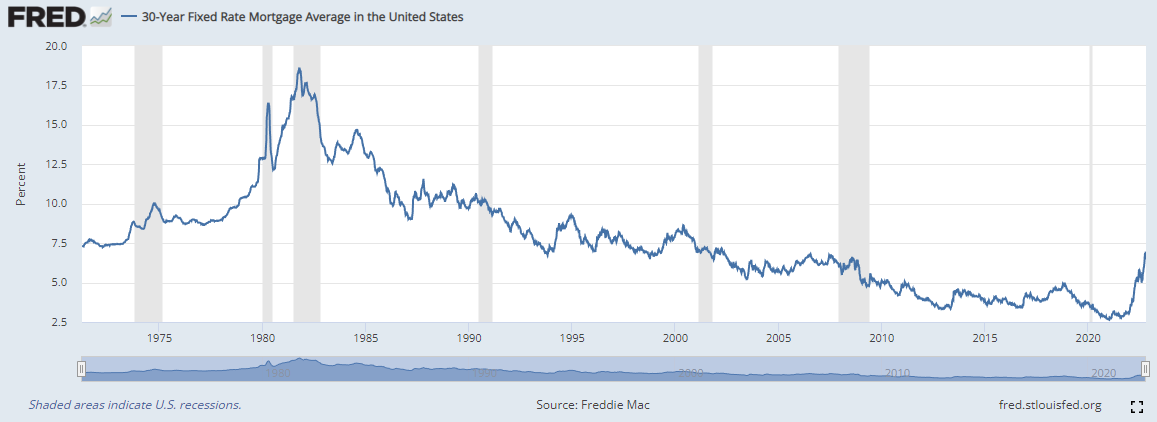
People think 7%+ mortgage rates are absolutely absurd (decades ago this was considered average and 40+ years ago, 7% was low!). This is how much the economy has been binging on this liquidity “drug”.

Think back when the WHO announced the COVID outbreak back in Jan 2020, did you or anyone realize the world would enter a new normal? With rates rising this fast, we are in a new normal so what has worked in the old normal no longer applies—we’re in an inflationary bear market.
30-Year Fixed Rate Mortgage Average in the US
This Week
The Fed is on a media blackout until the Nov 1-2 FOMC meeting, so they will not be able to confirm or deny what is being reported.
There are some heavy hitting reports this week that can make or break the month of October. Again, we might see the Mon-Tues rally pattern then weakness heading into Wed-Fri due to big economic reports and earnings hitting later in the week.
Mon, Oct 24 📈
US Manufacturing and Services PMI (it should be weak and close to almost recession levels and that’s “good new” as it helps the fight against inflation)—a very strong report would halt the bear market rally
Earnings: Discover Financial DFS 0.00%↑ should be similar to American Express AXP 0.00%↑ beating expectations but guidance can be less optimistic as loss reserves are predicted to increase
Tues, Oct 25 📈
2 Year auction (a bad auction will spike yield as we have been seeing every week)
Earnings: Microsoft MSFT 0.00%↑ (should be decent earnings but guide weaker, declining revenue growth + have rising costs due to FOREX), UPS UPS 0.00%↑ (might be similar to FedEx but not as bad), GM GM 0.00%↑ (car demand should be falling pretty dramatically so guidance will be rough), Coca-Cola KO 0.00%↑ (should outperform like PepsiCo did), Enphase ENPH 0.00%↑ (they have beaten earnings 22x in a row, they should have another strong earnings), Visa V 0.00%↑ (should perform slightly worst than American Express and guidance will be bad around loss reserves)
Wed, Oct 26 🦘📈—rally should start to lose steam into Wed and Facebook should show continued weakness
5 Year auction
New home sales—mostly priced in as market expects low numbers
Earnings: Facebook META 0.00%↑ (revenue per user will be down due to competition from TikTok while costs are up and Metaverse is losing them a lot of money, I don't expect strong earnings from Facebook), Boeing BA 0.00%↑ (should have great earnings given the airlines news and Saudi Arabia ordering 70+ more jets), Ford F 0.00%↑ (should show drop in demand and guidance will reflect lower car sales expectations, they also raised prices on their cars, which worsens their demand outlook)
Thurs, Oct 27 🦘📉—Apple, Amazon, Shopify, and Credit Suisse are market changing earnings
7 Year auction
GDP, jobless claims, durable goods orders should all come in weaker than expected—this should fuel the rally further as market anticipates a “Fed Pause”
Earnings: Apple AAPL 0.00%↑ (this one is huge, they should beat but throw some fear into their guidance as demand drops, anything about China will be interesting), Credit Suisse CS 0.00%↑ (how much money have they lost? their earnings can be quite bad and put fear back into the market), Amazon AMZN 0.00%↑ and Shopify SHOP 0.00%↑ will be huge earnings regarding guidance on consumer spending trend which should show consumers are pulling back, especially on online purchases.
Fri, Oct 28 🦘📉—biggest risk day
PCE and Core PCE price index: this is likely to show increase in Core PCE numbers, so higher than expected is bad for the rally
Real disposable income and retail consumer spending: mostly priced in but if retail consumer spending is showing demand is falling off a cliff, would be a risk off event
Pending home sales—is mostly priced in and the market expects homes sales to struggle going forward
Earnings: ExxonMobil XOM 0.00%↑ , Chevron CVX 0.00%↑ should both report strong earnings and guide higher oil prices due to supply constraints (this would not be good news for inflation),
Upcoming Things to watch out for ⚠
Oil prices: they are rising and XLE 0.00%↑ and oil companies are looking to break out even higher, this is bad news because as the Fed has said many times "we need help from the supply side and if we don't get help, it will be unfortunately more painful."
10 Year (Nov 9) and 30 Year (Nov 10) Auctions in early Nov: The next big auction is the beginning of November, after the Fed meeting. I believe we will see weakness in the market if the 10 Year and 30 Year bond auctions do not go well and suffer from liquidity problems.
Global trade and decoupling: China has not announced any retaliation against the Biden Administration’s semiconductor ban but they will. The supply side yet again not helping the Fed out.
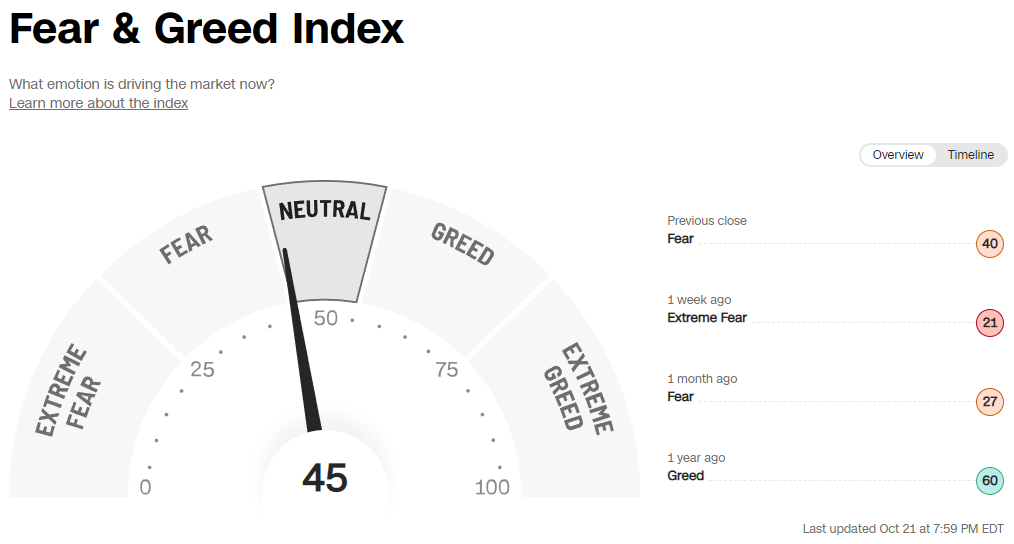
Fear & Greed Index: I will be cautious once this moves back to Greed levels
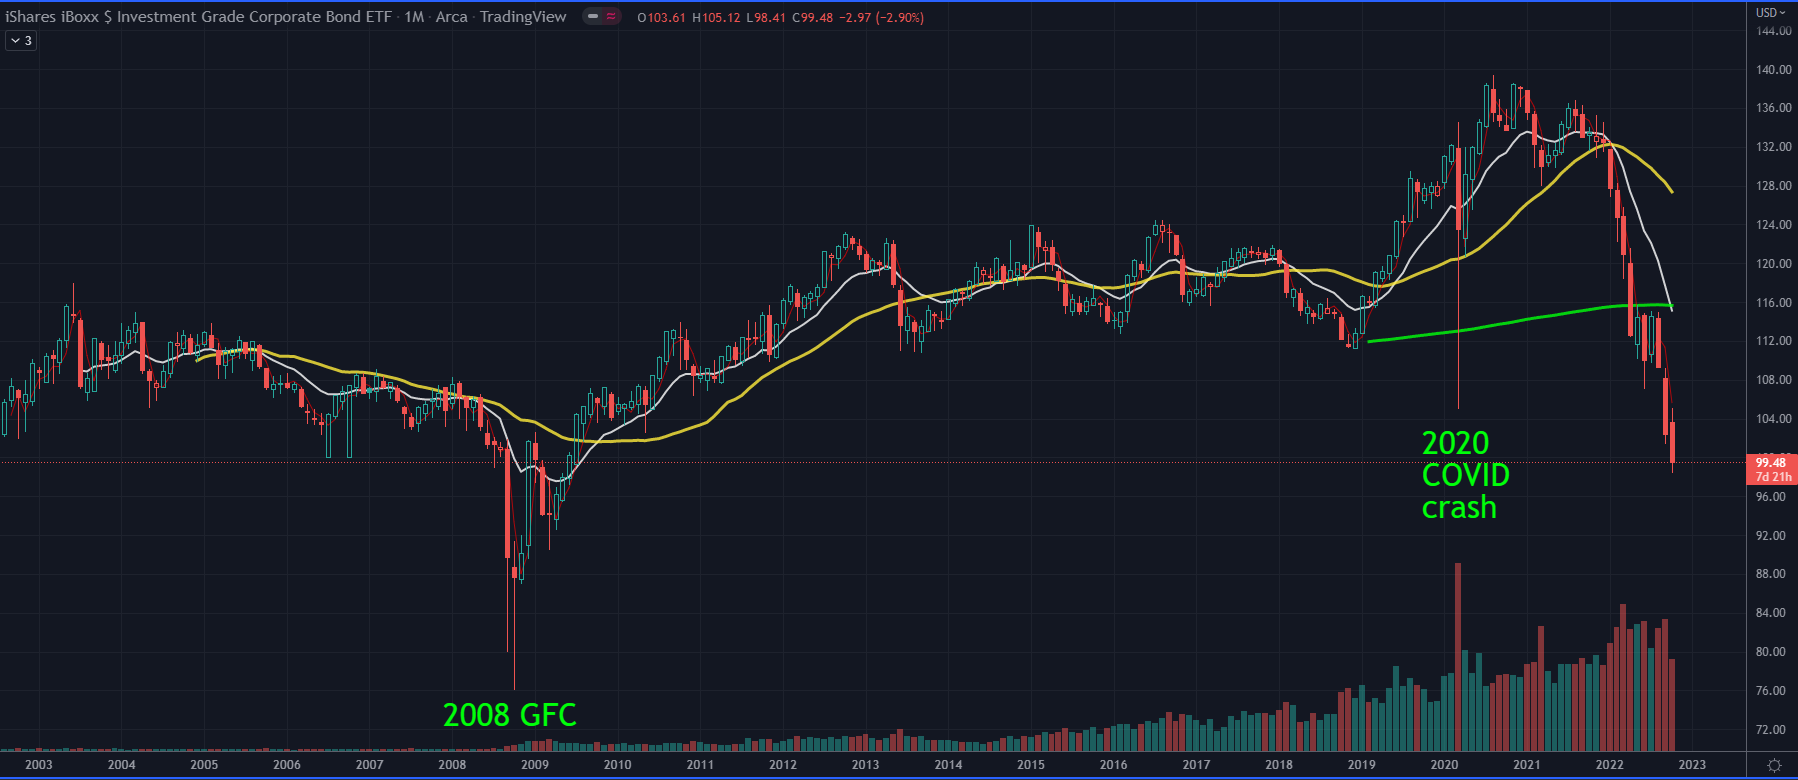
Investment Grade Corporate Bond LQD 0.00%↑ made a lower low last week and has seen 12 red months out of 15 months since Aug 2021.
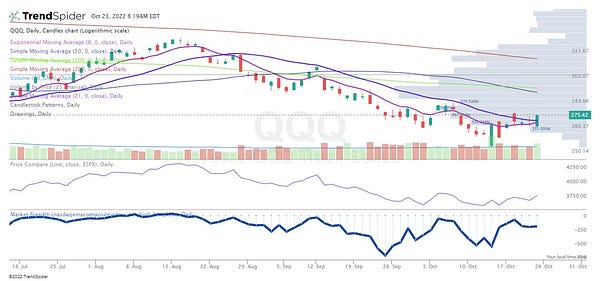
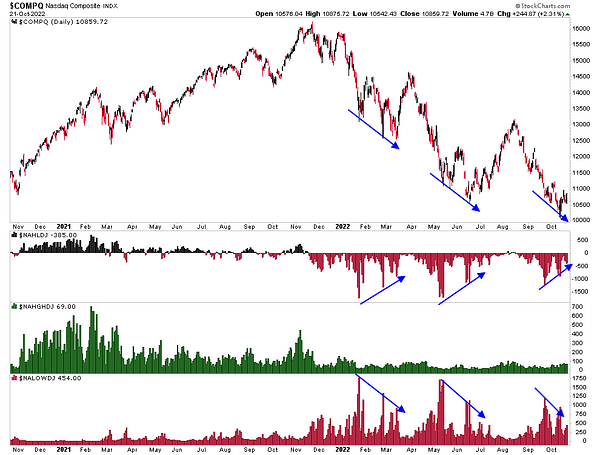
Net new lows is something to watch on the indexes, especially Nasdaq. Bear markets make net new lows week after week, month after month—which has been the case the past 7+ months. We’re just simply not in a convincing bull market until we get back to making net new highs.
Crypto
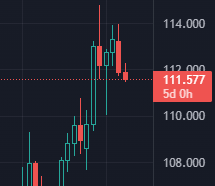
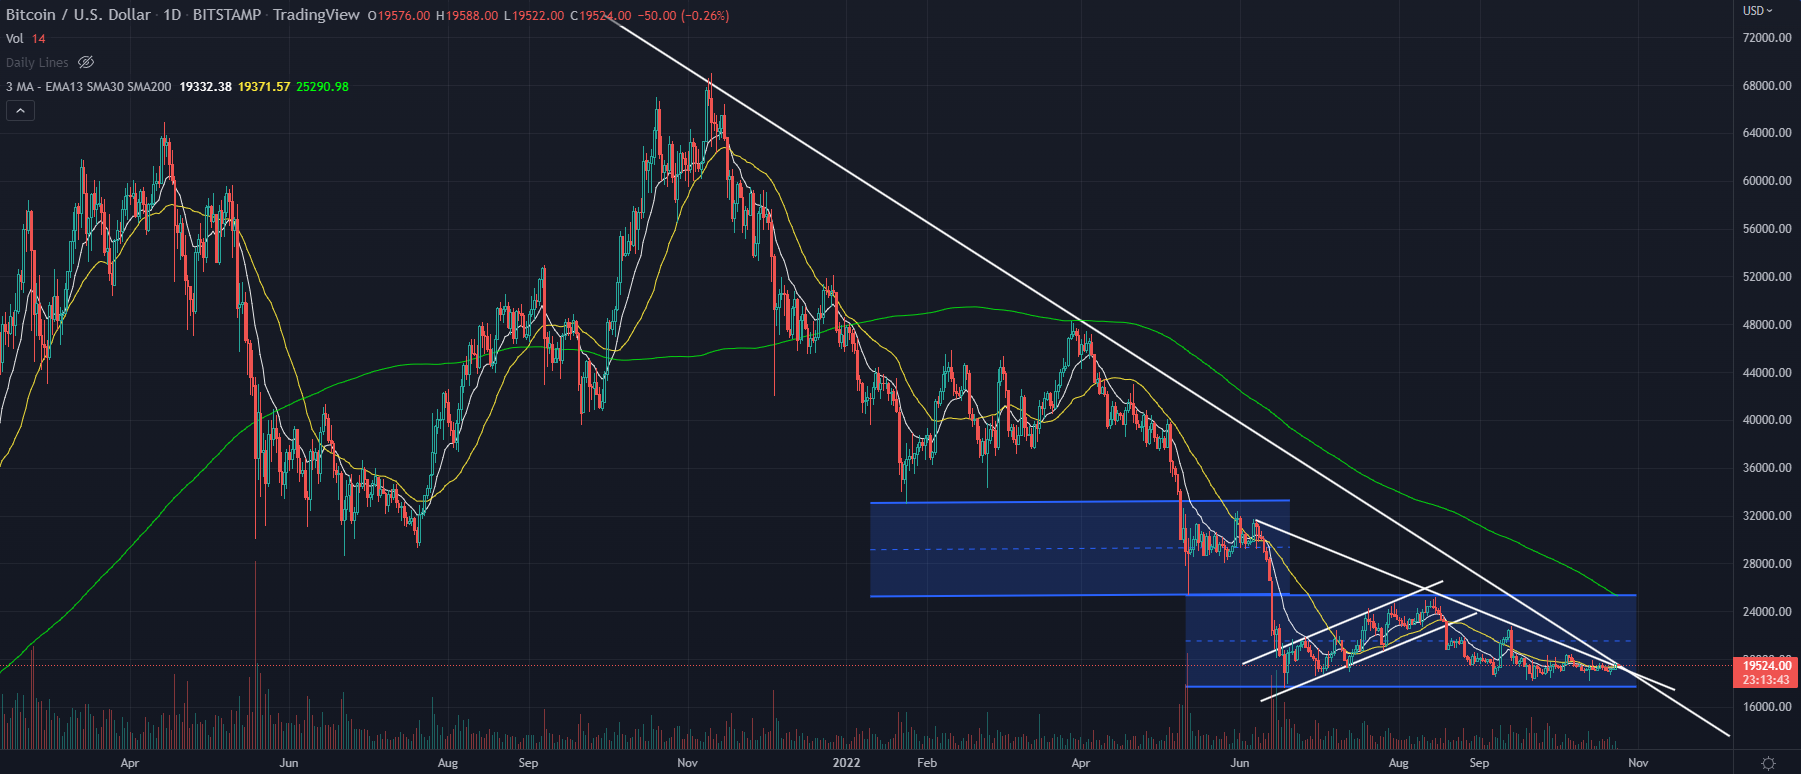
Bitcoin looks like it wants to breakdown or breakout here…price is struggling at the bottom of the channel and it’s a declining trendline. Given we know liquidity is being drained I am betting around the Fed meeting in early November, we will see the next big move soon.
Bitcoin daily chart
Options Flow
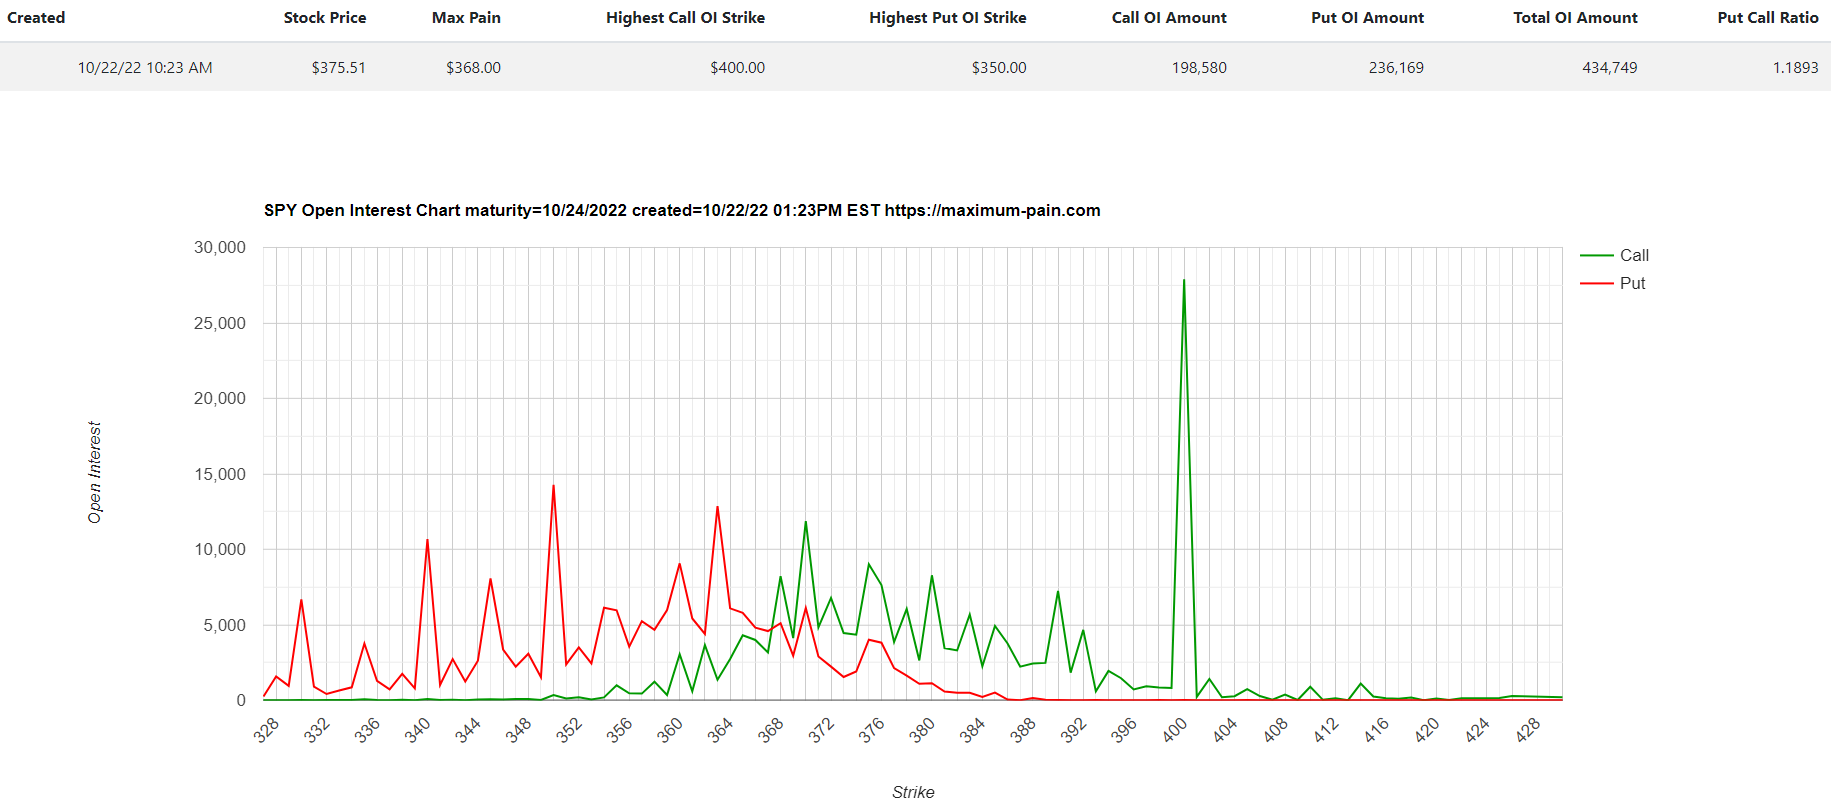
Based on the options flow, I looks like 370-390 will be the new trading range—I don’t see in the options flow that we will rise above 400 this week. This information can change once I review the options flow at Monday’s close as new positions are entered since we just had Oct monthly OPEX (options expiration) last Friday.
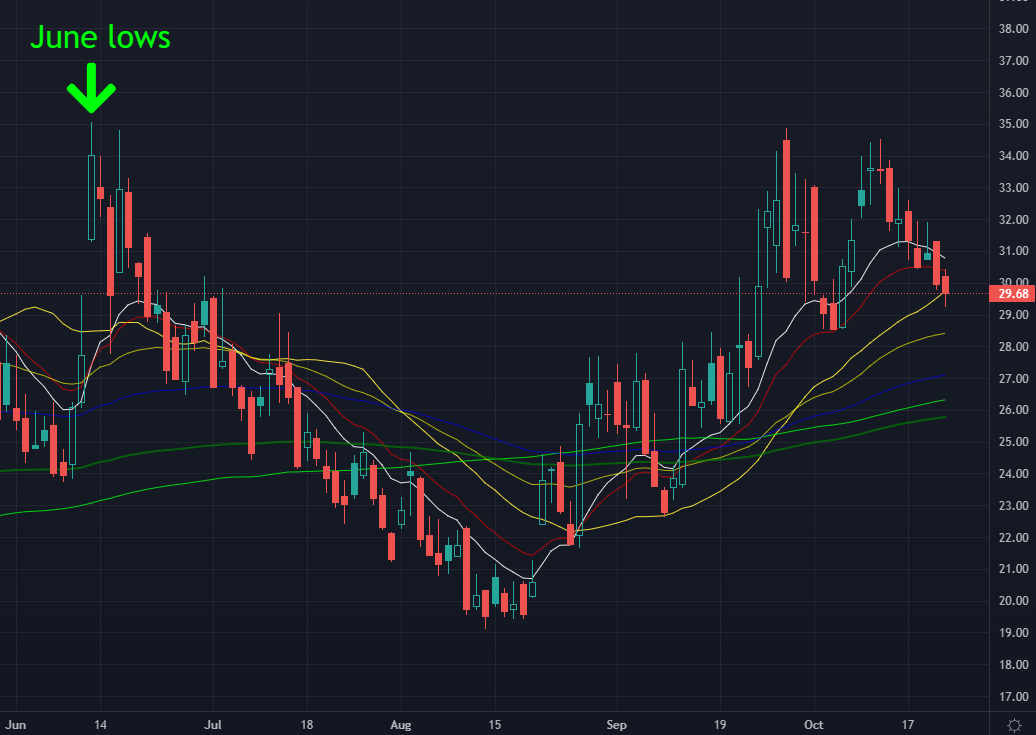
VVIX daily chart: almost back down to low 80s where we saw the market reverse to the downside—something to watch
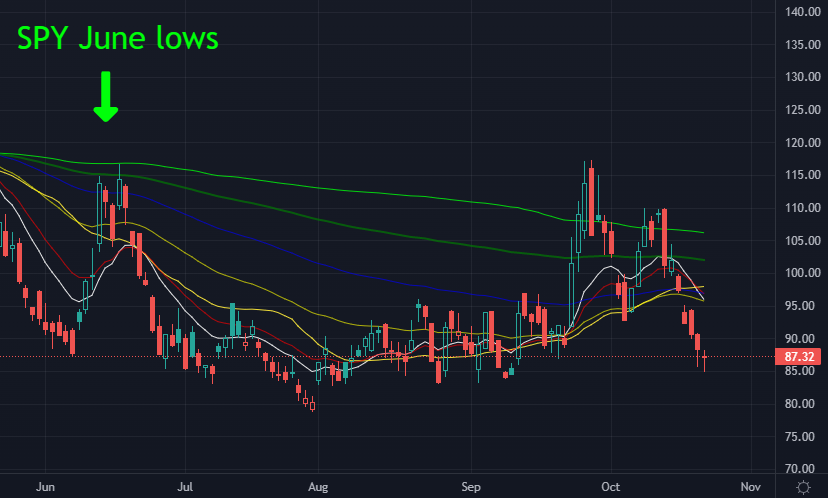
VIX daily chart: rallies peak close to the low 20s and market reverses when VIX spikes towards 35, which is what happened in early Oct
Insightful Tweets
Watch the net new lows.

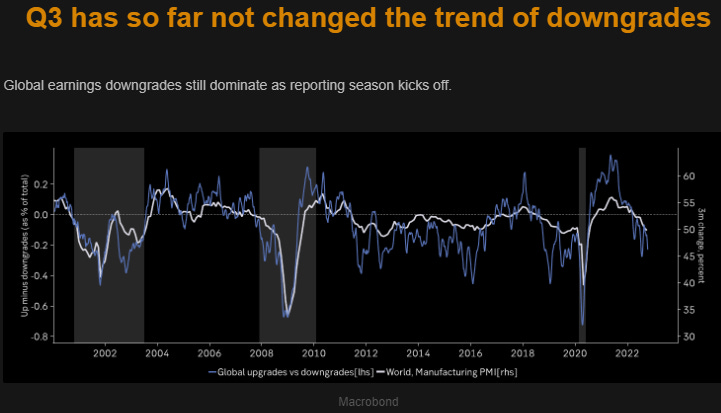
Q3 earnings have been ok so far; however, it continues the trend of the previous earnings seasons of downgrades ⚠
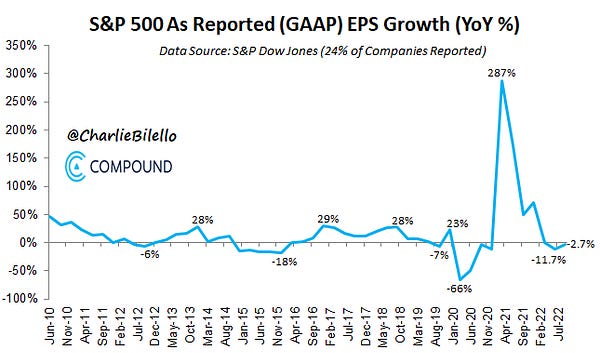
S&P 500 GAAP earnings are down -2.7% YoY, the 2nd quarter in a row of negative YoY growth. This is a dress rehearsal for what’s to come one year from now.

Although earnings look good, they are beating less than usual.


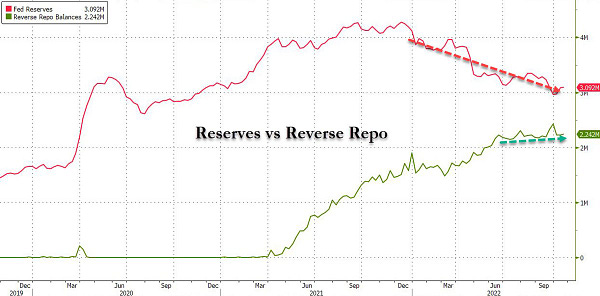
Fed reserves are declining while reverse repos are on the trend up—this means net liquidity available to the market is declining.
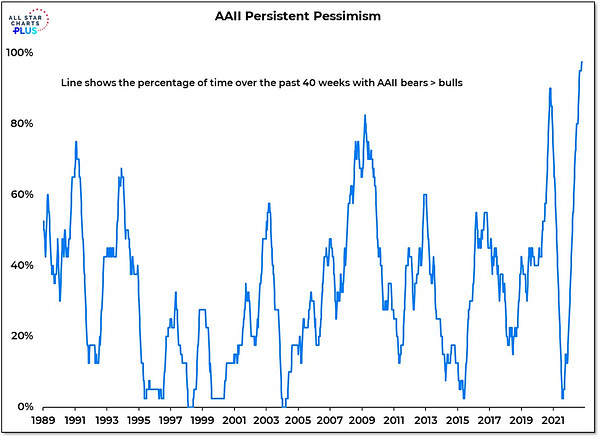
Sentiment has gotten too too bearish and the profit / pain trade is a sharp FOMO bounce—it’s just in bear markets it’s hard to call when that tradeable bottom will be

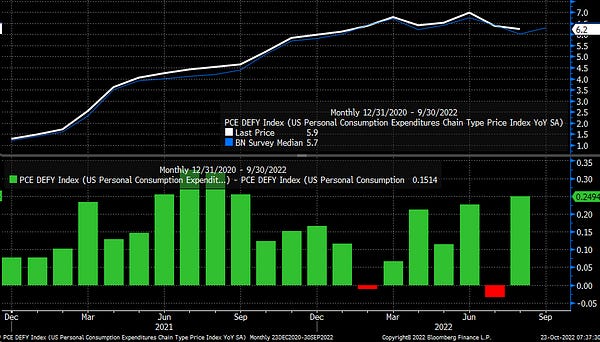
If headline PCE rises we will abruptly sell off—the Fed looks at PCE more closely than CPI to make their interest rate adjustments

Geopolitical Risks
Not a good sign when currency markets are so volatile—big players can default on contractual obligations they may have that’s connected to treasury holdings. Or they leveraged those treasury holdings to take on more risk like the UK pension fund did and get margin called.

Really interesting thread and warning about the bond markets

*This is not investment advice—I am not a financial advisor but a random person on the internet who does not have a license in finance or securities. This is my personal Substack which consists of opinions and/or general information. I may or may not have positions in any of the stocks mentioned. Don’t listen to anyone online without evaluating and understanding the risks involved and understand that you are responsible for making your own investment decisions.
About me: I majored in Applied Economics & Management at Cornell University, so I love to keep learning about macro and trying to figure things out when it comes to risk assets and markets so I write about it on my personal blog/Substack here.


