


The Russell 2000 Saw a Key Weekly Close
Jobs data continues to come in better than expected even against tariffs uncertainty
Recap
❌ We retested SPX 6000 and saw a weekly close above it. With a better than expected jobs report, the market closed well above positive gamma territory last Friday. My bearish thesis on the jobs report should start to show some weakness was incorrect.

New 52-Week Highs vs New 52-Week Lows
NYSE New 52-Week Highs: 83 vs New 52-Week Lows: 13
Nasdaq New 52-Week Highs: 175 vs New 52-Week Lows: 38
New Highs - New Lows continues bullish

Based on the McClellan Summation Index, the tariffs dip was the dip to buy. Hindsight is 20/20.

*This my personal blog and is not investment advice—I am not a financial advisor but a random person on the internet who does not have a license in finance or securities. This is my personal Substack which consists of opinions and/or general information. I may or may not have positions in any of the stocks mentioned. Don’t listen to anyone online without evaluating and understanding the risks involved and understand that you are responsible for making your own investment decisions.
The Russell 2000 is Sending a Bullish Signal
I thought the jobs market would start to show report below expectations (DOGE cuts, tariffs impact, to AI layoffs) but it has been more resilient than I expected.

The latest U.S. jobs report for May 2025 showed nonfarm payrolls increasing by 139,000, which was above market expectations of around 125,000 but marked a slowdown from the downwardly revised 147,000 jobs added in April. The unemployment rate held steady at 4.2%, remaining within the narrow range observed over the past year. Job gains were concentrated in health care (+62,000), leisure and hospitality (+48,000), and social assistance (+16,000), while federal government employment continued to decline (-22,000).
Average hourly earnings rose by 0.4% for the month
The report suggests the labor market remains resilient but is gradually cooling, with most industries showing little change in employment outside the main growth sectors.
IWM is at a key point, if it breaks higher and stays above 212 on the weekly chart, things will turn more bullish

Another IWM chart analysis—inverse head & shoulders pattern with what looks like a breakout

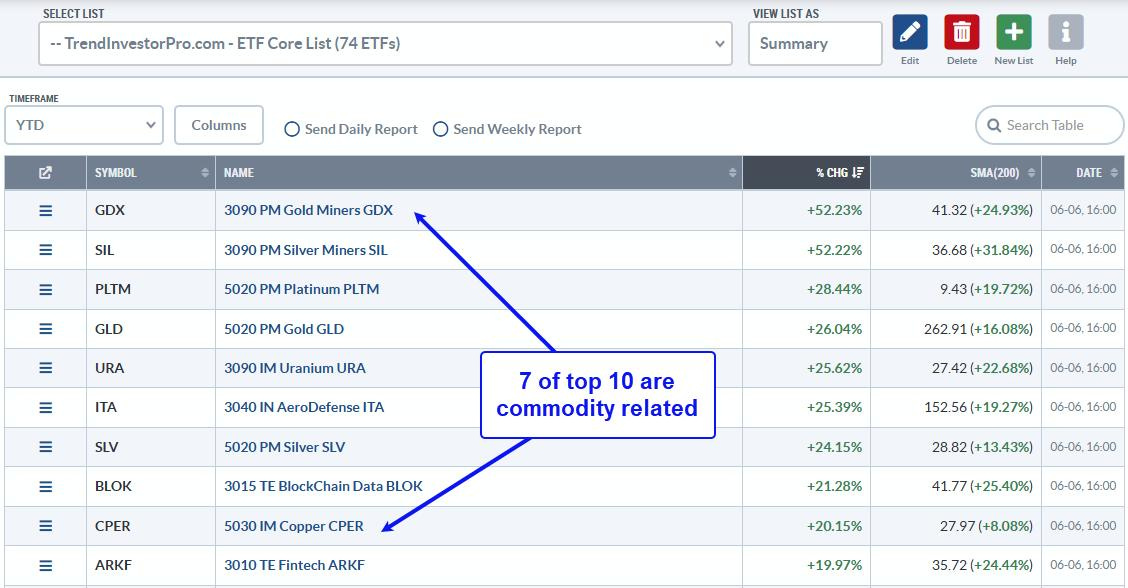
The metals are also leading which lines up with thesis around Fiscal Dominance trap and how the market is expecting the US to monetize its debt and likely go back to QE.

Q1 earnings are coming in fine and much better than expected

Bearish Posts
With the May jobs report came in healthy, the jobs market is normalizing.

Reminder that Trump’s 90-day tariff pause ends July 9.

So far, even with the housing market seeing high mortgage the impact to the economy has not been felt.


The upcoming bill could cause some volatility towards July

This uncertainty index likely will peak as the fight over the spending bill comes up.

Something likely upcoming, could it be the debt ceiling that’s around the corner?

Will we have another SVB situation?

Forecast
We continue in greed

Bullish sentiments stays at 32% level
Keep reading with a 7-day free trial
Subscribe to Best of Twitter/Threads, Analysis & Forecasts to keep reading this post and get 7 days of free access to the full post archives.